KOSIN UNIVERSITY COLLEGE OF MEDICINE
Articles
- Page Path
- HOME > Kosin Med J > Volume 32(2); 2017 > Article
-
Case Report
Imaging of F-18 FDG PET/CT and follow up of bilateral invasive adrenal diffuse large B cell lymphoma mimicking adrenocortical carcinoma - Hye Kyung Shim, So Woon Kim
-
Kosin Medical Journal 2017;32(2):269-276.
DOI: https://doi.org/10.7180/kmj.2017.32.2.269
Published online: December 29, 2017
1Department of Nuclear Medicine, Inje University Haeundae Paik Hospital, Busan, Korea.
2Department of Pathology, Asan Medical Center, University of Ulsan College of Medicine, Seoul, Korea.
- Corresponding Author: Hye Kyung Shim, Department of Nuclear Medicine, Inje University Haeundae Paik Hospital, 875, Haeun-daero, Haeundae-gu, Busan 48108, Korea. Tel: +82-51-797-2941, Fax: +82-51-797-2910, Shimhk80@naver.com
• Received: October 17, 2016 • Revised: October 26, 2016 • Accepted: December 5, 2016
Copyright © 2017 Kosin University College of Medicine
- 774 Views
- 0 Download
Abstract
- The incidence of malignant adrenal tumors, including primary adrenal lymphoma (PAL) and adrenocortical carcinoma (ACC), is rather low. Early differentiation between ACC and PAL is necessary because the therapeutic strategies for the two differ and the prognosis of each disease is poor. Unfortunately, there is no pathognomonic characteristic of PAL, so radiologists have difficulty in differentiating it from ACC. To our knowledge, there have been only two case reports on ACC that was evaluated and followed up using F-18 FDG PET/CT. The previously reported cases were simple, involving only the bilateral adrenal glands. Here, we report on a 52-year-old man diagnosed with PAL that radiologically mimicked ACC. He had findings of heterogeneous enhancement on CT, several adjacent lymphadenopathies with internal necrosis, and abutting hepatic and bilateral crural invasion. After pathological confirmation, we monitored his prognosis using F-18 FDG PET/CT after three cycles of rituximab-CHOP and again after six cycles of treatment.
- A 52-year-old man was admitted for a one-month history of epigastric pain and dyspepsia. He was diagnosed with hypertension eight years previously, and consequently was being treated with oral antihypertensive medication. Five years earlier, he had been diagnosed with seropositive rheumatoid arthritis and Raynaud's syndrome, and had used non-steroidal anti-inflammatory drugs (NSAIDs) as needed. At admission, his blood pressure was 120/80 mmHg, his pulse rate was 89 BPM, and his body temperature was 36.2℃. He had ingested alcohol for 20 years and did not smoke. On physical examination, he reported radiating pain in his back.
- A complete blood count showed a hemoglobin level of 14.6 g/dL, hematocrit of 43.2%, white blood cell count of 5,290/mL, and platelet count of 230,000/µL. To rule out pain originating from his pancreas, amylase, lipase, and CA 19-9 testing were performed and found to be within normal limits. His sodium level was slightly decreased at 136 mM/L (normal range, 138–148 mM/L), but potassium, chloride, and calcium levels were all normal.
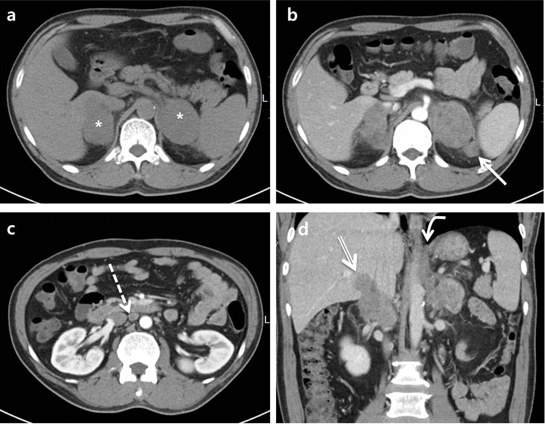
- Chest radiography was normal with no hilar lymphadenopathy. Abdominopelvic CT (APCT) scans demonstrated large bilateral adrenal masses, which were probably the cause of his radiating back pain. The left adrenal gland measured 5.0 × 6.2 × 6.0 cm and the right adrenal gland measured 3.7 × 5.7 × 5.0 cm. The left adrenal gland mass was heterogeneously enhanced and invaded to the left crus. Another small, enhanced lymph node (LN) measuring 2.0 cm was also noted around the superior pole of the left kidney. The right adrenal gland mass was also heterogeneously enhanced, directly invaded segment 1 (S1) of the liver, and partially invaded the right crus. A 2.8-cm enlarged LN in the retrocaval area and several enlarged LNs with some necrosis in the aortocaval and left paraaortic area were also noted (Fig. 1).
- Laboratory tests to evaluate the bilateral adrenal masses were also performed. Serum β2-microglobulin concentration was slightly increased to 3.0 µg/mL (normal range, 1–2.4 µg/mL) and serum lactate dehydrogenase level was increased to 628 IU/L (normal range, 120–250 IU/L). Serum basal cortisol concentration was normal at 18 µg/dL (normal range, 5–25 µg/dL), and plasma basal adrenocorticotropic hormone (ACTH) level was increased to 282 pg/mL (normal range, 0–60 pg/mL). Urinalysis showed that the 24-hour excretion of vanillylmandelic acid was 4.3 mg/day (normal range, < 8.0 mg/day), epinephrine was 0.6 µg/day (normal range, 0–20.0 µg/day), norepinephrine was 63.8 µg/day (normal range, 15.0–80.0 µg/day), dopamine 283.6 µg/day (normal range, 65.0–400.0 µg/day), and total metanephrine 0.485 mg/day (normal range, ≤ 0.80 mg/day). Plasma renin activity increased to 18.47 ng/mL/h (normal range, 0.15–2.33 ng/mL/h), and his aldosterone level was 5.85 ng/dL (normal range, 0.75–15.0 ng/dL). A rapid cosyntropin (analog of ACTH) stimulation test, using 250 µg of intravenous cosyntropin, demonstrated plasma cortisol concentrations of 17.1, 19.7, and 18.9 µg/dL at 0, 30, and 60 min respectively (reference range, ≥ 7 µg/dL at 0 min, ≥ 16 µg/dL at 30 min, and ≥ 18 µg/dL at 60 min). As the majority of pheochromocytomas are associated with increased urinary catecholamine secretion, bilateral pheochromocytoma was excluded. Slightly decreased sodium, increased plasma ACTH, and suboptimal cortisol response to ACTH testing suggested a mild degree of adrenal insufficiency. The chief complaint of this patient may have been related to the mass effect of bilateral adrenal gland enlargement with no symptoms directly related to adrenal insufficiency.
- In order to exclude metastases of the adrenal glands, esophagogastroduodenoscopy (EGD), colonoscopy, and F-18 FDG PET/CT were also performed. F-18 FDG PET/CT showed intense FDG uptake in both adrenal glands with invasion of S1 of the liver (Right adrenal gland, maxSUV 37.2; left adrenal gland, maxSUV 35.2). Enlarged lymph nodes were demonstrated on APCT (Fig. 2a), suggesting malignant adrenal masses. There were no other abnormalities visible on images of the rest of the body to suggest primary malignancy. The findings of the EGD and colonoscopy were also normal.
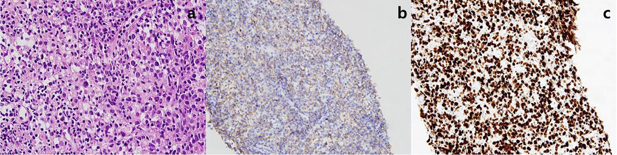
- Relying only on laboratory and radiologic findings, we could not differentiate between ACC and PAL. Adjacent organ invasion and heterogeneous enhancement after IV contrast medium was administered suggested a provisional diagnosis of ACC. A CT-guided biopsy of the left adrenal mass was performed for definitive diagnosis. The mass was diagnosed as diffuse large B-cell lymphoma, which was immunohistochemically positive for CD20 but negative for CD3, CD5, CD10, and CD30 (Fig. 3a, b). The Ki-67 labeling index was about 90% (Fig. 3c). A bone marrow biopsy was negative for lymphomatous involvement. The clinical staging by the Ann Arbor system was IV A and the international prognostic index placed him in the low intermediate risk group.
- He was administered R-CHOP chemotherapy, consisting of rituximab (375 mg/m2 IV), cyclophosphamide (750 mg/m2 IV), doxorubicin (50 mg/m2 IV), and vincristine (1.4 mg/m2 IV) on day 1 and prednisolone (60 mg/m2 PO) on days 1–5, repeated every 3 weeks. After three cycles of R-CHOP chemotherapy, the mass had decreased in size on follow-up CT with no definite residual hypermetabolism on F-18 FDG PET/CT scan (Fig. 2b). After completing six cycles of R-CHOP chemotherapy, the size was even more decreased on CT with no abnormal metabolism noted on F-18 FDG PET/CT (Fig. 2c). This patient continues to be followed up without definitive evidence of recurrence.
CASE
- The differential diagnosis of adrenal tumors includes primary tumors originating from the adrenal cortex or the adrenal medulla, as well as metastases from other origins. Benign adenomas comprise the majority of asymptomatic adrenal masses. Once adrenal masses are detected, their nature and endocrine function must be defined in order to exclude malignancy and hormonal dysfunction. Primary malignant tumors in adrenal glands are ACC, PAL, and malignant pheochromocytomas. Adrenal glands are frequently the site of metastatic disease caused by primary carcinomas. We excluded metastases from other organs due to a lack of abnormal findings on F-18 FDG PET/CT, EGD, and colonoscopy. Primary pheochromocytoma was also excluded due to normal urine catecholamine excretion. ACC accounts for about 0.02–0.2% of all cancer-related deaths and up to 14% of adrenal incidentalomas. It shows a bimodal age distribution with peak incidences in the first and fifth decades of life. Women are more often affected than men, at a ratio of 1.5:1. About 79% of the tumors are functional.1 Bilateral manifestation is found in only 10% of cases reported. The average tumor size is approximately 11.5–12 cm (range: 2–36 cm), with only 4.2% of tumors smaller than 6 cm. PAL represents only 3% of extranodal lymphomas. Histologically, the most common type is diffuse large B-cell lymphoma.2 PAL is most common in elderly men; the mean age at diagnosis is 68 years and the male-to-female ratio is 2.2:1. Clinical symptoms of PAL include fever, weight loss, localized pain, and symptoms of adrenal insufficiency.3 Immune dysfunction may be a predisposing factor in some patients.4 A review of 55 patients diagnosed with PAL showed that eight (15%) had concurrent or a past history of carcinoma, two (4%) had human immunodeficiency virus (HIV), and seven (13%) had concomitant autoimmune disease.3 This patient was diagnosed with seropositive rheumatoid arthritis and Raynaud's syndrome before being diagnosed with PAL. Adrenal insufficiency is rare because it becomes apparent only when approximately 90% of adrenal cortex is destroyed.5 Approximately 50% of patients with primary adrenal lymphoma present with symptoms of adrenal insufficiency.6 Our patient had no specific symptoms suggestive of adrenal insufficiency; only his laboratory results were indicative of mild adrenal insufficiency.
- CT images of ACC show a large mass with central necrosis or calcification of the tumor in up to 30% of cases. The typical appearance of ACC on an unenhanced CT shows a large inhomogeneous but well-defined mass that displaces adjacent structures.7 Enhancement is heterogeneous after administration of contrast medium, with relatively little central enhancement seen secondary to necrosis.8 Venous extensions, local invasion, and lymph node or other metastases (primarily of the lungs and liver) are common in advanced ACC.9 There are only a fewtudies evaluating the role of FDG PET in the management of patients with a diagnosis of ACC.10 Paling et al. reviewed 173 cases of non-Hodgkin's lymphoma (NHL), and demonstrated that lymphoma involving the adrenal glands is either a discrete mass of variable attenuation or shows an infiltrative, ill-defined appearance on CT images.11
- There has been a lack of uniform consensus on the definition of PAL in the past.12 Recently, however, there have been efforts to better define this disease entity.13 Currently, PAL is diagnosed when either of the following conditions are present: there is an absence of extra-adrenal involvement, or, if lymph nodes or other organs are involved, the adrenal lesion is dominant. Previous reports of patients diagnosed with PAL by F-18 FDG PET/CT imaging were mainly identified using the first condition; however, our patient was classified using the latter. In fact, in 2005 Kumar et al. reviewed the 70 cases in the literature and reported that PAL should be considered in a patient presenting with bilateral adrenal masses without nodal involvement in addition to the involvement of other organs.14 Enhancement after administration of a contrast agent is usually uniform and low-to-moderate in intensity, and less than that of the aorta or inferior vena cava.914 Although radiological appearance is not pathognomonic in the majority of PAL cases, the findings of local invasiveness and heterogeneous enhancement are more common in adrenocortical carcinoma than in lymphoma. The findings of pre-contrast homogeneous attenuation, enhancement less than that of the large vessels, and relative preservation of bilateral adrenal contours are more common in lymphoma. The possibility for metastasis in our patient is less likely because of the fact that solid organs rarely invade adjacent organs. In addition, our patient had no other abnormality to suggest primary malignancy on PET-CT, and EGD and colonoscopy showed no hidden malignancy. Radiologically, we could not differentiate between adrenocortical carcinoma or primary adrenal lymphoma; clinical setting and final pathological confirmation defined the correct diagnosis.
- On F-18 FDG PET/CT, normal adrenal glands are only weakly FDG-avid while most malignancies demonstrate significantly greater FDG uptake than the background. False negative results may occur with hemorrhagic and necrotic tumors. Variable inflammatory processes such as tuberculosis and sarcoidosis can cause false positive results. As adrenal lymphoma is a very rare disease, there have been no large clinical studies using F-18 FDG PET/CT to date. Hitherto, there have been only two cases detailing staging and treatment follow-up using F-18 FDG PET/CT.214 In addition, the previously reported cases only showed adrenal involvement without other areas of abnormal uptake. Unfortunately, both ACC and PAL are highly FDG-avid so we cannot differentiate these two malignant tumors by F-18 FDG PET/CT; however, F-18 FDG PET/CT can reveal staging, local recurrence, and the result of treatment follow-up.15 Our case showed successful treatment response, with decreased FDG avidity in adrenal lesions and metastatic lymph nodes, and the involved adrenal glands returning to their original size and configuration.
- In conclusion, PAL is a very rare entity, so only limited cases using F-18 FDG PET/CT have been reported. Our patient showed highly FDG-avid PAL mimicking adrenocortical carcinoma before biopsy. He had nearly complete remission after three cycles of R-CHOP, and the size was even more decreased after six cycles of R-CHOP. These results suggest the possibility for evaluation of early responsiveness of chemotherapy using F-18 FDG PET/CT.
DISCUSSION
- 1. Luton JP, Cerdas S, Billaud L, Thomas G, Guilhaume B, Bertagna X, et al. Clinical features of adrenocortical carcinoma, prognostic factors, and the effect of mitotane therapy. N Engl J Med 1990;322:1195–1201.ArticlePubMed
- 2. Kim KM, Yoon DH, Lee SG, Lim SN, Sug LJ, Huh J, et al. A case of primary adrenal diffuse large B-cell lymphoma achieving complete remission with rituximab-CHOP chemotherapy. J Korean Med Sci 2009;24:525–528.ArticlePubMedPMC
- 3. Wang J, Sun NC, Renslo R, Chuang CC, Tabbarah HJ, Barajas L, et al. Clinically silent primary adrenal lymphoma: a case report and review of the literature. Am J Hematol 1998;58:130–136.ArticlePubMed
- 4. Grigg AP, Connors JM. Primary adrenal lymphoma. Clin Lymphoma 2003;4:154–160.ArticlePubMed
- 5. Kuyama A, Takeuchi M, Munemasa M, Tsutsui K, Aga N, Goda Y, et al. Successful treatment of primary adrenal non-Hodgkin's lymphoma associated with adrenal insufficiency. Leuk Lymphoma 2000;38:203–205.ArticlePubMed
- 6. Ozimek A, Diebold J, Linke R, Heyn J, Hallfeldt K, Mussack T. Bilateral primary adrenal non-Hodgkin's lymphoma and primary adrenocortical carcinoma--review of the literature preoperative differentiation of adrenal tumors. Endocr J 2008;55:625–638.ArticlePubMed
- 7. Dong A, Cui Y, Wang Y, Zuo C, Bai Y. (18)F-FDG PET/CT of adrenal lesions. AJR Am J Roentgenol 2014;203:245–252.ArticlePubMed
- 8. Bharwani N, Rockall AG, Sahdev A, Gueorguiev M, Drake W, Grossman AB, et al. Adrenocortical carcinoma: the range of appearances on CT and MRI. AJR Am J Roentgenol 2011;196:W706–W714.ArticlePubMed
- 9. Lyon SM, Lee MJ. Imaging the non-hyperfunctioning adrenal mass. Imaging 2002;14:137–146.Article
- 10. Deandreis D, Leboulleux S, Caramella C, Schlumberger M, Baudin E. FDG PET in the management of patients with adrenal masses and adrenocortical carcinoma. Horm Cancer 2011;2:354–362.ArticlePubMedPMC
- 11. Paling MR, Williamson BR. Adrenal involvement in non-Hodgkin lymphoma. AJR Am J Roentgenol 1983;141:303–305.ArticlePubMed
- 12. Rashidi A, Fisher SI. Primary adrenal lymphoma: a systematic review. Ann Hematol 2013;92:1583–1593.ArticlePubMed
- 13. Parameswaran R, Chan DKH, Michelle PLM, Wang S. Primary Adrenal Diffuse Large B-cell Lymphoma: A Mini Review. World J Endoc Surg 2015;7:65–68.Article
- 14. Kumar R, Xiu Y, Mavi A, El-Haddad G, Zhuang H, Alavi A. FDG-PET imaging in primary bilateral adrenal lymphoma: a case report and review of the literature. Clin Nucl Med 2005;30:222–230.ArticlePubMed
- 15. Leboulleux S, Dromain C, Bonniaud G, Aupérin A, Caillou B, Lumbroso J, et al. Diagnostic and prognostic value of 18-fluorodeoxyglucose positron emission tomography in adrenocortical carcinoma: a prospective comparison with computed tomography. J Clin Endocrinol Metab 2006;91:920–925.ArticlePubMed
References
Fig. 1

(a) re-contrast APCT scan shows large, homogeneous soft tissue masses in bilateral adrenal glands (asterisks)(b,c,d) ontrast-enhanced APCT scan shows adjacent lymph node enlargement (straight arrow), retroperitoneal enlarged lymph nodes involving internal necrosis (dotted arrow), adjacent liver (double-lined arrow) and crural invasion (curved arrow).
Fig. 2
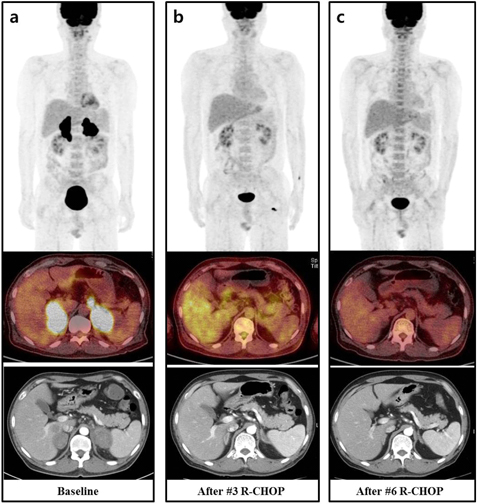
(a) Baseline F-18 FDG PET/CT (maximal intensity projection (MIP), axial images) and post-contrast APCT scanshow intense FDG accumulation in bilateral adrenal glands, right hepatic invasionand adjacent left gastric lymph node involvement. (b) After cycles of R-CHOP, no definite residual hypermetabolism is noted on F-18 FDG PET/CTand marked decreasesize of both adrenal glands is demonstrated on post-contrast APCT. (c) After cycles of R-CHOP, F-18 FDG PET/CT shows metabolically complete remission, and post-contrast APCT showsize of both adrenal glands compared with interim post-contrast APCT.
Fig. 3

(a) The biopsy specimen of adrenal mass shows diffuse atypical lymphoid cellinfiltration replacing normal adrenal gland. The tumor consists of medium-to-large polymorphic cells (H&E Original magnifications, ×400)(b, c) he atypical cells are positive for CD20 immunohistochemical staining and the Ki-67 labeling index is about 90% (×200).
Figure & Data
References
Citations
Citations to this article as recorded by 
 PubReader
 ePub Link
 Cite
Cite