KOSIN UNIVERSITY COLLEGE OF MEDICINE
Articles
- Page Path
- HOME > Kosin Med J > Volume 27(1); 2012 > Article
-
Case Report
A Case of F-18 FDG PET-CT Detection of Sporadic Medullary Thyroid Carcinoma and Cervical Lymph Node Metastasis of Ovarican Cancer - Joo Wan Seo, Chang Jun Park, Yun Kyung Jeon, Sang Soo Kim, Bo Hyun Kim, In Ju Kim
-
Kosin Medical Journal 2012;27(1):51-56.
DOI: https://doi.org/10.7180/kmj.2012.27.1.51
Published online: June 11, 2012
Department of Internal Medicine, College of Medicine, Pusan National University, Busan, Korea.
- Corresponding Author: Bo Hyun Kim, Division of Endocrinology and Metabolism, Department of Internal Medicine, Pusan National University Hospital, 305 Gudeok-ro, Seo-gu, Busan 602-739, Korea. TEL: 051) 240-7678, FAX: 051) 254-3217, pons71@hanmail.net
• Received: January 24, 2012 • Revised: March 1, 2012 • Accepted: March 6, 2012
Copyright © 2012 Kosin University College of Medicine
- 876 Views
- 1 Download
Abstract
- Medullary thyroid carcinoma (MTC) is derived from the parafollicular or C-cells. As surgical resection is the only curative therapy for MTC, the early diagnosis is important for the patient's survival. F18-Fluorodeoxyglucose positron emission tomography-computed tomography (F-18 FDG PET CT) is a noninvasive imaging method which can be used to diagnose malignant thyroid tumors including recurrent or residual MTC. However, due to the limitations of this technique, it is difficult to differentiate benign from malignant thyroid tumors. We herein present a 47-year-old woman with ovarian cancer history who was found to have thyroid incidentaloma with metastatic cervical lymph node through F-18 FDG PET CT. Thyroid incidentaloma of the patient was examined by fine needle aspiration and the result of this diagnostic procedure showed suspicious MTC. The patient was subsequently diagnosed as having sporadic medullary thyroid carcinoma and metastatic cervical lymph node due to ovarian cancer.
- 1. Girelli ME, Nacamulli D, Pelizzo MR, De Vido D, Mian C, Piccolo M, et al. Medullary thyroid carcinoma: clinical features and long-term follow-up of seventy-eight patients treated between 1969 and 1986. Thyroid 1998;8:517–523.ArticlePubMed
- 2. You YN, Lakhani V, Wells SA Jr, Moley JF. Medullary thyroid cancer. Surg Oncol Clin N Am 2006;15:639–660.ArticlePubMed
- 3. Cohen MS, Arslan N, Dehdashti F, Doherty GM, Lairmore TC, Brunt LM, et al. Risk of malignancy in thyroid incidentalomas identified by fluorodeoxyglucose-positron emission tomography. Surgery 2001;130:941–946.ArticlePubMed
- 4. Mulligan LM, Kwok JB, Healey CS, Elsdon MJ, Eng C, Gardner E, et al. Germ-line mutations of the RET proto-oncogene in multiple endocrine neoplasia type 2A. Nature 1993;363:458–460.ArticlePubMed
- 5. Leboulleux S, Baudin E, Travagli JP, Schlumberger M. Medullary thyroid carcinoma. Clin Endocrinol (Oxf) 2004;61:299–310.ArticlePubMed
- 6. Szakáll S Jr, Esik O, Bajzik G, Repa I, Dabasi G, Sinkovics I, et al. 18F-FDG PET detection of lymph node metastases in medullary thyroid carcinoma. J Nucl Med 2002;43:66–71.PubMed
- 7. Giraudet AL, Vanel D, Leboulleux S, Aupérin A, Dromain C, Chami L, et al. Imaging medullary thyroid carcinoma with persistent elevated calcitonin levels. J Clin Endocrinol Metab 2007;92:4185–4190.ArticlePubMed
- 8. Adams S, Baum R, Rink T, Schumm-Dräger PM, Usadel KH, Hör G. Limited value of fluorine-18 fluorodeoxyglucose positron emission tomography for the imaging of neuroendocrine tumours. Eur J Nucl Med 1998;25:79–83.ArticlePubMed
- 9. Frilling A, Becker H, Roeher HD. Unusual features of multiple endocrine neoplasia. Henry Ford Hosp Med J 1992;40:253–255.PubMed
- 10. Nishimura Y, Yamashita K, Yumita W, Yamazaki M, Katai M, Sakurai A, et al. Multiple endocrine neoplasia type 1 with unusual concomitance of various neoplastic disorders. Endocr J 2004;51:75–81.ArticlePubMed
References
Fig. 1F-18 FDG PET CT. The F-18 FDG PET CT shows focal uptake in left lobe of thyroid gland, both cervical lymph nodes, mediastinal lymph node and both supraclavicular lymph nodes
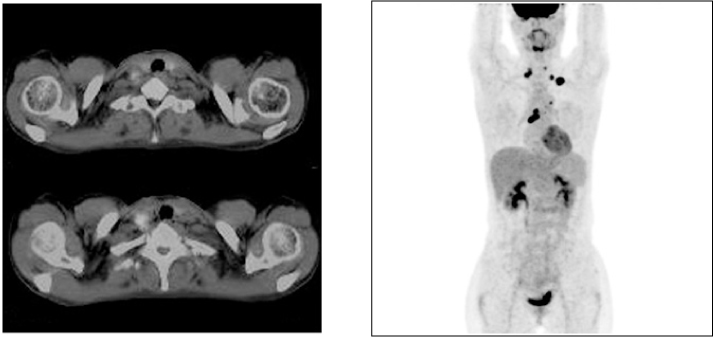
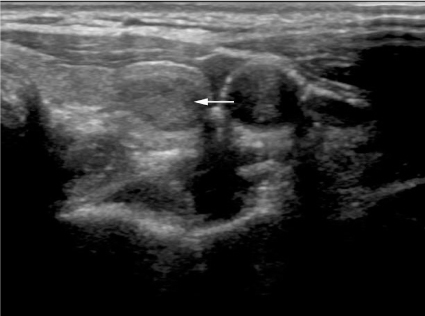
Fig. 2Ultrasound finding. Thyroid ultrasound shows hypoechoic nodule of 1.03×0.25 cm in left lobe of thyroid gland (arrow).

Fig. 4Microscopic finding of left lobe of thyroid gland. (A) In scanning view of the tumor, mass is confined to thyroid gland. (B) Low-power view of the tumor shows nest pattern of tumor cells and separated by firbrovascular stroma (H&E stain, ×100). (C) High-power view of the tumor shows polygonal or spindle shape of tumor cells (H&E stain, ×400). (D) Synaptophysin stain was positive.
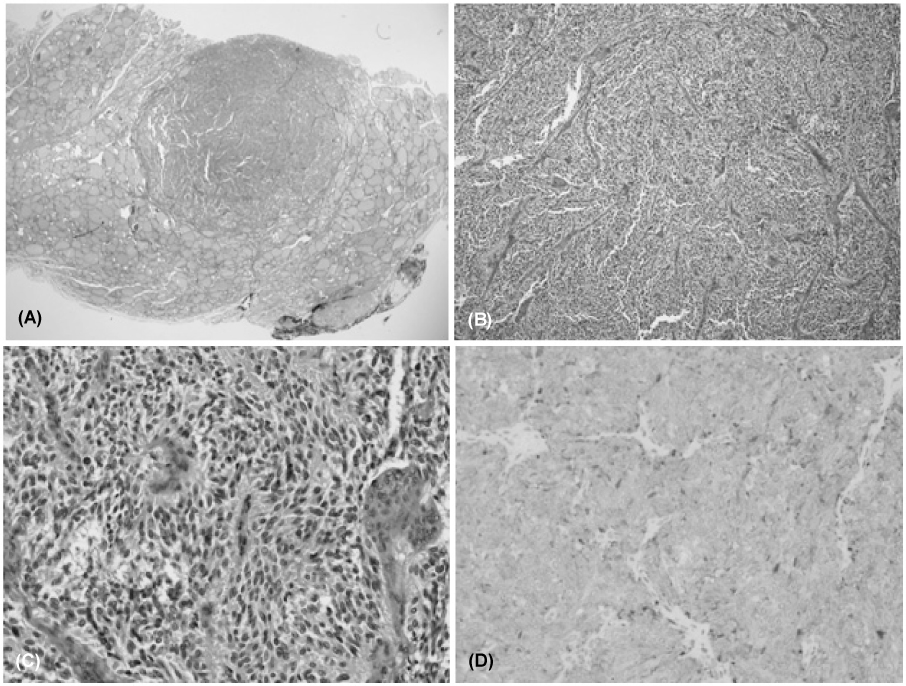

Figure & Data
References
Citations
Citations to this article as recorded by 
 PubReader
 ePub Link
 Cite
Cite