 KOSIN UNIVERSITY COLLEGE OF MEDICINE
Articles
- Page Path
- HOME > Kosin Med J > Volume 33(2); 2018 > Article
-
Original Article
The effect of short-term particular matter2.5 exposure on asthma attacks in asthma children in Fukuoka, Japan - Song Han Lee1, Koh Woon Lee1, Yoon Ha Hwang1, Hiroshi Odajima2
-
Kosin Medical Journal 2018;33(2):171-180.
DOI: https://doi.org/10.7180/kmj.2018.33.2.171
Published online: January 19, 2018
1Department of Pediatrics, Busan St. Mary’s Hospital, Busan, Korea
2Department of Pediatrics, Fukuoka National Hospital, Japan, Korea
- Corresponding Author: Lee Song Han, Department of Pediatrics, Busan St. Mary’s Hospital 25-14, Yongho-ro, 232 beon-gil, Nam-gu, Busan 48575, Korea Tel: +82-52-246-6113 Fax: +82-52-246-6113 E-mail: thdgks33@naver.com
• Received: September 21, 2016 • Accepted: October 24, 2016
Copyright © 2018 Kosin University School of Medicine Proceedings
This is an Open Access article distributed under the terms of the Creative Commons Attribution Non-Commercial License (http://creativecommons.org/licenses/by-nc/4.0/) which permits unrestricted non-commercial use, distribution, and reproduction in any medium, provided the original work is properly cited.
- 1,122 Views
- 4 Download
- 1 Crossref
Abstract
-
Objectives
- We investigated whether asthma attacks in asthmatic children were caused by short-term exposure to particulate matter(PM)2.5.
-
Methods
- Subjects were 411 patients who received inhalation therapy in National Fukuoka Hospital, from March to May 2013. All subjects were outpatients. We surveyed the air quality measurement results in the stations closest to the address of the patients. Data were used from the City of Fukuoka website data on air pollution. We carried out a case-crossover study and compared PM2.5 concentration between 7 days after asthma attack occurred and the day asthma attack occurred and 1, 2 and 3 days before asthma attack occurred.
-
Results
- Highest hourly concentration of the day (OR 1.013, 95%CI 1.000-1.025) showed a significant association with 1 day before PM2.5 concentration statistically. And 0-1 year-old infants were more vulnerable to the highest concentration of 1 day before PM2.5 concentration(P < 0.05). Average concentration of NO2 and O3 and asthma attack also showed a significant association.
-
Conclusions
- Maximal daily PM2.5 concentrations within 24 hours prior to the attack affect asthma exacerbation. 0-1 year-old infants are particularly vulnerable to PM2.5 concentration. Asthma exacerbation is aggravated by NO2 and O3 concentration on the day of the asthma attack.
Fig. 1.Map of monitoring stations in Fukuoka. The table on the left shows the names of monitoring stations, the number of asthma patients, and percentage.
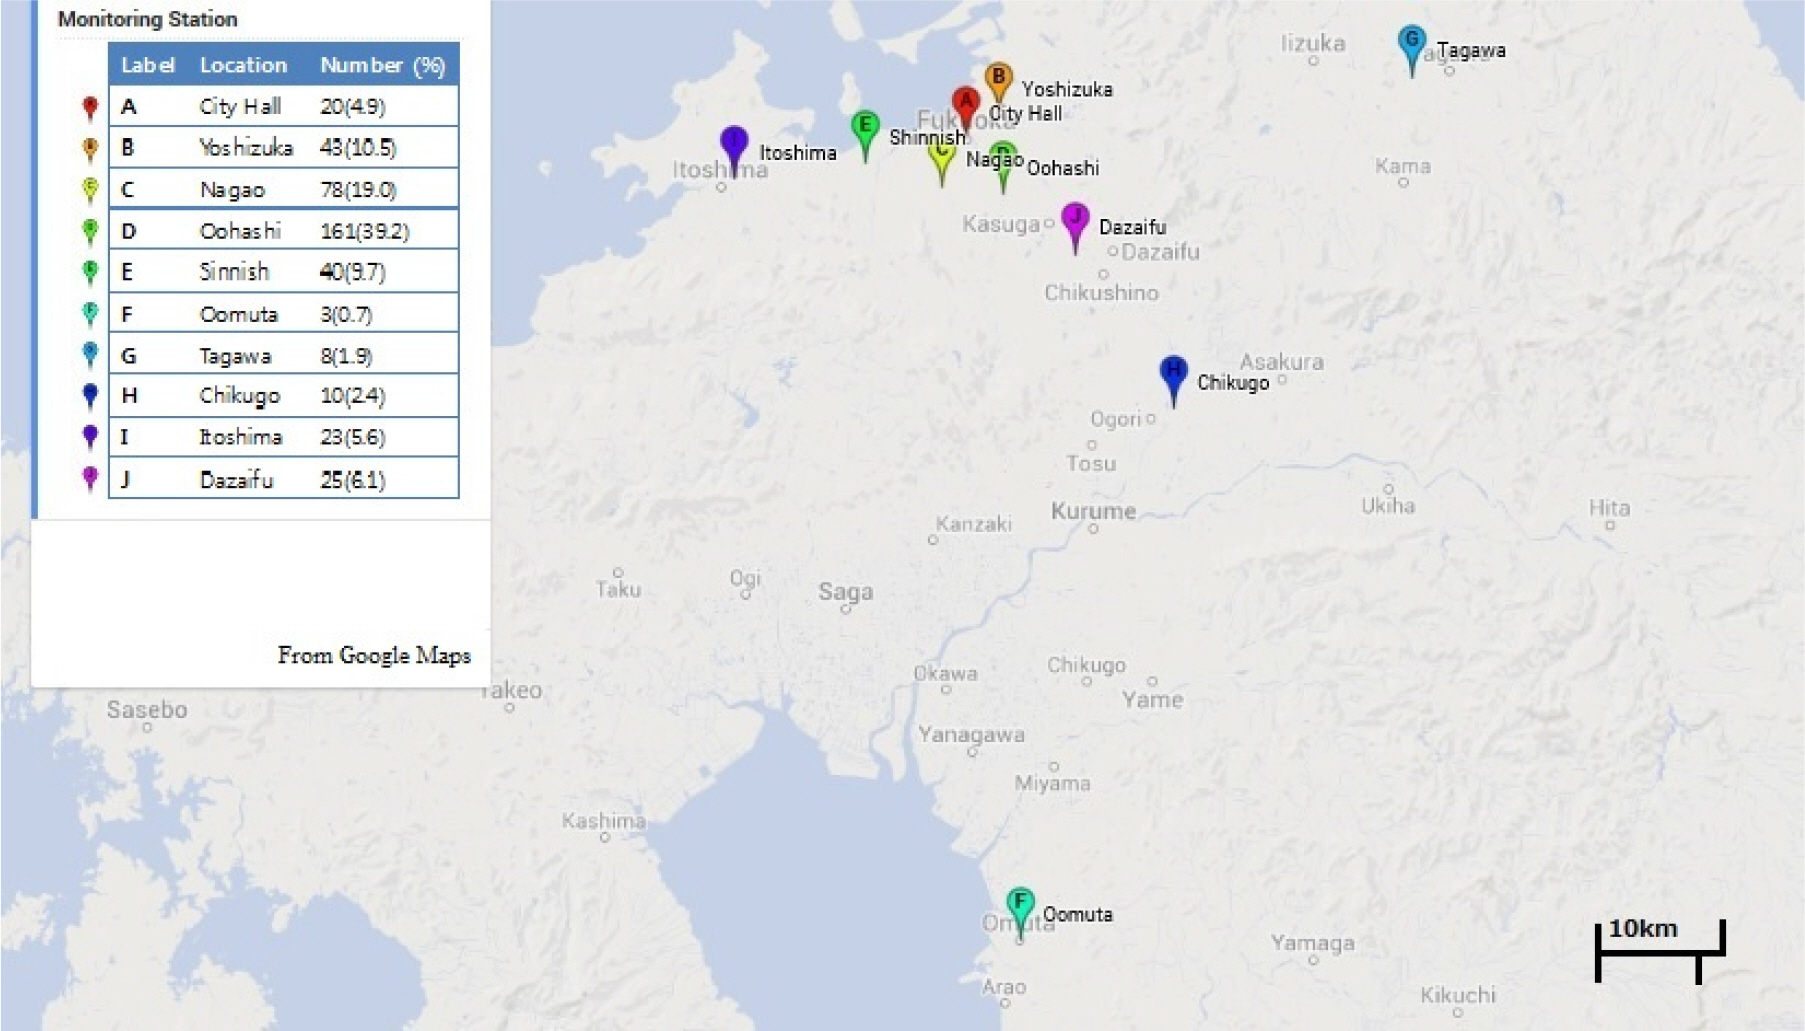
Table 1.Characteristics of the study groups.
| Number | Percent | |
|---|---|---|
| Total | 411 | |
| Sex ratio (M:F) | 1.45 | |
| Mean age(± SD) | 5.58 ± 4.41 | |
| Age | ||
| 0-1 | 97 | 23.6 |
| 2-5 | 142 | 34.5 |
| 6-12 | 136 | 33.1 |
| 13-15 | 30 | 7.3 |
| Over 16 | 6 | 1.5 |
Table 2.Comparison of maximal, average concentration of PM2.5 (μg/㎥).
| D-3‡ | Control day | D-2§ | Control day | |
|---|---|---|---|---|
| Average(maximal) | 35.65 | 36.50 | 35.52 | 33.91 |
| Standard deviation | 18.53 | 19.34 | 18.73 | 16.81 |
| P | 0.522 | 0.196 | ||
| D-1∥ | Control day | D0¶ | Control day | |
| Average(maximal) | 35.44 | 32.84 | 35.71 | 34.53 |
| Standard deviation | 18.22 | 15.63 | 18.19 | 18.23 |
| P | 0.029 | 0.352 | ||
| D-3‡ | Control day | D-2§ | Control day | |
| Average(average) | 22.21 | 22.92 | 21.81 | 21.47 |
| Standard deviation | 12.33 | 13.98 | 11.54 | 12.64 |
| P | 0.439 | 0.684 | ||
| D-1∥ | Control day | D0¶ | Control day | |
| Average(average) | 21.34 | 19.81 | 21.95 | 21.17 |
| Standard deviation | 11.89 | 11.00 | 13.06 | 12.43 |
| P | 0.057 | 0.382 |
Table 3.Odds ratios and 95% confidence intervals of asthma attack by maximal 1-hour concentration of each air pollutant.
| D-3‡ | D-2§ | ||||||
|---|---|---|---|---|---|---|---|
| OR* | 95%CI† | P | OR* | 95%CI† | P | ||
| PM2.5 | Single-variant | 0.998 | 0.990-1.005 | 0.522 | 1.005 | 0.997-1.013 | 0.196 |
| Multi-variant | 0.841 | 0.719-0.983 | 0.030 | 0.932 | 0.844-1.029 | 0.165 | |
| SPM | Single-variant | 0.993 | 0.986-1.000 | 0.067 | 0.998 | 0.990-1.006 | 0.579 |
| Multi-variant | 1.160 | 1.037-1.297 | 0.009 | 1.060 | 0.981-1.146 | 0.142 | |
| NO2 | Single-variant | 1.004 | 0.988-1.021 | 0.615 | 1.013 | 0.997-1.029 | 0.105 |
| Multi-variant | 0.973 | 0.885-1.069 | 0.564 | 1.101 | 1.012-1.197 | 0.026 | |
| O3 | Single-variant | 0.984 | 0.971-0.997 | 0.197 | 0.986 | 0.972-0.999 | 0.042 |
| Multi-variant | 1.174 | 1.089-1.264 | 0.000 | 1.043 | 0.995-1.094 | 0.081 | |
| D-1∥ | D0¶ | ||||||
| OR* | 95%CI† | P | OR* | 95%CI† | P | ||
| PM2.5 | Single-variant | 1.009 | 1.001-1.017 | 0.030 | 1.004 | 0.996-1.011 | 0.352 |
| Multi-variant | 1.063 | 0.944-1.195 | 0.313 | 0.954 | 0.874-1.040 | 0.286 | |
| SPM | Single-variant | 1.004 | 0.996-1.012 | 0.318 | 1.002 | 0.995-1.009 | 0.598 |
| Multi-variant | 0.992 | 0.903-1.090 | 0.874 | 1.027 | 0.968-1.090 | 0.380 | |
| NO2 | Single-variant | 1.016 | 1.000-1.033 | 0.052 | 1.010 | 0.995-1.026 | 0.197 |
| Multi-variant | 1.001 | 0.922-1.086 | 0.984 | 1.111 | 0.944-1.308 | 0.207 | |
| O3 | Single-variant | 1.003 | 0.988-1.019 | 0.661 | 1.015 | 0.999-1.030 | 0.065 |
| Multi-variant | 0.920 | 0.860-0.985 | 0.016 | 1.011 | 0.965-1.056 | 0.646 |
Table 4.Odds ratios and 95% confidence intervals of asthma attack by average daily concentration of each air pollutant.
| D-3‡ | D-2§ | ||||||
|---|---|---|---|---|---|---|---|
| OR* | 95%CI† | P | OR* | 95%CI† | P | ||
| PM2.5 | Single-variant | 0.996 | 0.986-1.006 | 0.439 | 1.002 | 0.991-1.014 | 0.683 |
| Multi-variant | 0.777 | 0.564-1.072 | 0.124 | 1.052 | 0.880-1.257 | 0.581 | |
| SPM | Single-variant | 0.992 | 0.981-1.002 | 0.133 | 0.994 | 0.983-1.005 | 0.304 |
| Multi-variant | 1.299 | 0.963-1.752 | 0.086 | 0.977 | 0.854-1.117 | 0.729 | |
| NO2 | Single-variant | 0.993 | 0.961-1.027 | 0.692 | 1.013 | 0.978-1.049 | 0.467 |
| Multi-variant | 0.815 | 0.601-1.103 | 0.185 | 1.271 | 1.027-1.572 | 0.027 | |
| O3 | Single-variant | 1.006 | 0.989-1.024 | 0.481 | 0.994 | 0.975-1.013 | 0.513 |
| Multi-variant | 1.475 | 1.179-1.846 | 0.001 | 1.128 | 1.031-1.234 | 0.009 | |
| D-1∥ | D0¶ | ||||||
| OR* | 95%CI† | P | OR* | 95%CI† | P | ||
| PM2.5 | Single-variant | 1.012 | 1.000-1.024 | 0.057 | 1.005 | 0.994-1.016 | 0.382 |
| Multi-variant | 1.068 | 0.907-1.259 | 0.430 | 1.004 | 0.893-1.129 | 0.941 | |
| SPM | Single-variant | 1.009 | 0.997-1.020 | 0.133 | 1.004 | 0.993-1.014 | 0.506 |
| Multi-variant | 0.952 | 0.835-1.085 | 0.456 | 0.974 | 0.894-1.063 | 0.558 | |
| NO2 | Single-variant | 1.018 | 0.985-1.052 | 0.299 | 1.034 | 1.002-1.068 | 0.040 |
| Multi-variant | 1.078 | 0.926-1.255 | 0.331 | 1.103 | 0.942-1.292 | 0.224 | |
| O3 | Single-variant | 1.016 | 0.997-1.035 | 0.097 | 1.031 | 1.012-1.050 | 0.001 |
| Multi-variant | 1.037 | 0.960-1.120 | 0.359 | 1.058 | 0.990-1.131 | 0.098 |
Table 5.Odds ratios and 95% confidence intervals of asthma attack by maximal 1-hour concentration of PM2.5 divided by age group.
- 1.United States Environmental Protection Agency (2012). viewed April 17 2013 http://www.epa.gov.
- 2.Bateson TF, Schwartz J. Children's response to air pollutants. J Toxicol Environ Health A 2008;71:238–43.ArticlePubMed
- 3.Strickland MJ, Darrow LA, Klein M, Flanders WD, Sarnat JA, Waller LA, et al. Short-term associations between ambient air pollutants and pediatric asthma emergency department visits. Am J Respir Crit Care Med 2010;182:307–16.ArticlePubMedPMC
- 4.Yamazaki S, Shima M, Ando M, Nitta H, Watanabe H, Nishimuta T. Effect of hourly concentration of particulate matter on peak expiratory flow in hospitalized children: a panel study. Environ Health 2011;10:15.ArticlePubMedPMC
- 5.Kelly FJ, Fussell JC. Air pollution and airway disease. Clin Exp Allergy 2011;41:1059–71.ArticlePubMed
- 6.Nishimuta T, Kondo N, Hamasaki Y, Morikawa A, Nishima S. Japanese guideline for childhood asthma. Allergology International 2011;60:147–69.ArticlePubMed
- 7.Ueda K, Nitta H, Odajima H. The effects of weather, air pollutants, and Asian dust on hospitalization for asthma in Fukuoka. Environ Health Prev Med 2010;15:350–7.ArticlePubMedPMC
- 8.Odajima H, Yamazaki S, Nitta H. Decline in peak expiratory flow according to hourly short-term concentration of particulate matter in asthmatic children. Inhal Toxicol 2008;20:1263–72.ArticlePubMed
- 9.Iskandar A. Andersen ZJ, Bonnelykke K, Ellermann T, Andersen KK, Bisgaard H. Coarse and fine particles but not ultrafine particles in urban air trigger hospital admission for asthma in children. Thorax 2012;67:252–7.ArticlePubMed
- 10.Lin S, Liu X, Le LH, Hwang SA. Chronic exposure to ambient ozone and asthma hospital admissions among children. Environ Health Perspect 2008;116:1725–30.ArticlePubMedPMC
- 11.Meng YY, Rull RP, Wilhelm M, Lombardi C, Balmes J, Ritz B. Outdoor air pollution and uncontrolled asthma in the San Joaquin Valley, California. J Epidemiol Community Health 2010;64:142–7.ArticlePubMed
- 12.Lipsett M, Hurley S, Ostro B. Air pollution and emergency room visits for asthma in Santa Clara Country, California. Environ Health Perspect 1997;105:216–22.ArticlePubMedPMC
- 13.Gauderman WJ, Avol E, Lurmann F, Kuenzli N, Gilliland F, Peters J, et al. Childhood asthma and exposure to traffic and nitrogen dioxide. Epidemiology 2005;16:737–43.ArticlePubMed
- 14.Selgrade MK, Plopper CG, Gilmour MI, Conolly RB, Foos BSP. Assessing the health effects and risks associated with children's inhalation exposures: asthma and allergy. J Toxicol Environ Health A 2008;71:196–207.ArticlePubMed
- 15.Trasande L, Thurston GD. The role of air pollution in asthma and other pediatric morbidities. J Allergy Clin Immunol 2005;115:689–99.ArticlePubMed
- 16.Gaudeman WJ, Avol E, Gilliland F, Vora H, Thomas D, Berhane K, et al. The effect of air pollution on lung development from 10 to 18 years of age. N Engl J Med 2004;351:1057–67.ArticlePubMed
- 17.Song S, Lee K, Lee YM, Lee JH, Lee SI, Yu SD, et al. Acute health effects of urban fine and ultrafine particles on children with atopic dermatitis. Environ Res 2011;111:394–9.ArticlePubMed
- 18.Konishi S, Ng CFS, Stickley A, Nishihata S, Shinsugi C, Ueda K, et al. Particulate matter modifies the association between airborne pollen and daily medical consultations for pollinosis in Tokyo. Sci Total Environ 2014;499:125–32.ArticlePubMed
- 19.Lim JM, Jeong JH, Lee JH, Moon JH, Chung YS, Kim KH. The analysis of PM2.5 and associated elements and their indoor/outdoor pollution status in an urban area. Indoor Air 2011;2:145–55.Article
References
Figure & Data
References
Citations
Citations to this article as recorded by 
- Annual changes in the prevalence of asthma may be related to air pollution in Fukuoka: 29 years of observation
Hiroshi Odajima, Toshiaki Kawano, Masatoshi Wakatsuki, Yuko Akaminea, Koki Okabe, Tuyoshi Oki, Hiroshi Matsuzaki, Yoko Murakami, Mihoko Iwata, Naohiko Taba, Chikako Motomura, Satoshi Honjo, Takahito Ninomiya
ERJ Open Research.2020; 6(2): 00166-2020. CrossRef
 PubReader
 ePub Link
 Cite
Cite
