Dietary education may reduce blood cadmium and mercury levels in chronic kidney disease patients with higher blood cadmium and mercury levels
Article information

Abstract
Background
Exposure to cadmium and mercury is associated with renal dysfunction. This study aimed to investigate the possible ability of dietary education to decrease blood cadmium and mercury levels in patients with chronic kidney disease (CKD).
Methods
Twenty-seven patients with CKD were enrolled in this prospective, single-arm pilot study. Patients with blood cadmium levels ≥1.4 μg/L were instructed to reduce their intake of shellfish, while those with blood mercury levels ≥5.0 μg/L were asked to reduce their intake of externally blue-colored fish.
Results
Seven dialysis patients and 15 pre-dialysis patients completed the study. Compared with baseline, the blood cadmium (2.0±0.7 μg/L vs. 1.8±0.7 μg/L, p=0.031) and mercury levels (4.4±2.6 μg/L vs. 3.5±1.9 μg/L, p=0.005) after 1 year significantly decreased, although the dietary intake was not significantly different in patients with blood cadmium levels ≥1.4 μg/L and blood mercury levels ≥5.0 μg/L. In pre-dialysis patients, kidney function worsened after 1 year compared with that at baseline despite the reduction in blood cadmium and mercury levels.
Conclusions
Reduction of food intake containing cadmium and mercury may lower the blood cadmium and mercury levels in CKD patients with higher cadmium and mercury levels. Higher blood cadmium levels may cause renal disease progression in pre-dialysis patients, and further studies are necessary to determine the underlying mechanisms.
Introduction
Chronic kidney disease (CKD) is a growing public health concern, and diabetes mellitus (DM), hypertension, and glomerulonephritis are known to be the main causes of CKD. Heavy metals can be considered an unfamiliar cause of CKD, especially when there are no definite etiologies of CKD [1]. Cadmium (Cd) is a heavy metal that causes renal tubular dysfunction and cardiovascular disease [2-4]. In hemodialysis (HD) patients, blood Cd level is one of the risk factors affecting mortality [5]. A recent cross-sectional study reported that Cd exposure was also risk factor for development and progression of CKD, particularly in vulnerable populations with hypertension or DM [6]. Therefore, the role of Cd exposure and Cd levels in the occurrence of CKD should not be neglected.
The primary source of human mercury (Hg) exposure is ingestion of food contaminated with Hg because Hg is readily absorbed by the gastrointestinal tract. Inorganic and organic forms of Hg readily accumulate in the kidney and may induce acute kidney injury by inorganic forms of Hg intoxication [7,8]. Epidemiologic studies investigating the relationship between CKD and Hg exposure are limited [9,10]. The exposed individuals with blood Hg levels ≥5.0 μg/L showed higher urine protein and higher serum creatinine levels than those with blood Hg levels <5.0 μg/L at Bibiani Ghana [11]. Efforts to lower or not increase until the Hg level (5.0 μg/L) suggested in the World Health Organization (WHO) guideline are important.
Toxic heavy metals are widely distributed and tend to accumulate in the environment. Dietary exposure is one of the primary causes of toxic heavy metal accumulation in the human body. The major source of dietary Cd intake is shellfish consumption, and Cd burdens are higher in the seaside areas of Korea [12]. Another study showed that blood Hg concentrations increased with increasing annual fish consumption such as mackerel and tuna [13]. This study was designed to identify whether blood Cd and Hg levels can be lowered through dietary education in CKD patients. We also aimed to analyze the changes in kidney function and proteinuria in patients with pre-dialysis CKD.
Methods
Ethical statements: The protocol was approved by the Institutional Review Board of Dong-A University Hospital (IRB No. DAUHIRB-17-199) and performed in accordance with the principles of the Declaration of Helsinki. Written informed consent to participate was obtained from all participants.
1. Study design and population
We conducted a prospective, single-arm, pilot study of patients with CKD from December 2017 to September 2020. Twenty-seven CKD patients including seven dialysis patients with baseline blood Cd levels ≥1.4 μg/L or blood Hg levels ≥5.0 μg/L were enrolled. The cutoff value for blood Hg level was determined based on the WHO guidelines, while that for blood Cd level was determined based on the mean blood Cd level in 128 Korean CKD patients [6].
Patients with baseline blood Cd levels <1.4 μg/L and blood Hg levels <5.0 μg/L, those who did not receive dietary education or did not participate in a nutrition survey, and those who had no caregivers to prepare their meals were excluded.
The primary outcome was the change in blood Cd and Hg levels. The secondary outcomes included changes in renal function and proteinuria in the pre-dialysis patients. All enrolled patients were asked about their average food consumption frequency and portion size of food consumed at the initiation of the study and after 1 year.
2. Survey of nutrition
The survey was conducted using a semiquantitative food frequency questionnaire targeting 121 foods. The patients’ nutritional intake was estimated using the Computer-Aided Nutritional Analysis Program (Can-Pro 3.0, The Korean Nutrition Society), which includes data on 1,823 foods.
All participants were requested to prepare a meal diary, which can be used for dietary education, a month before visiting the outpatient clinic. For example, patients with high blood Cd levels recorded the type and quantity of shellfish consumed for a month, while those with high blood Hg levels recorded the type and quantity of fish consumed for a month.
3. Dietary education
Dietary education was conducted every 3 to 4 months, and at least three outpatient visits were required per year. The dietary education was implemented as follows.
1) In patients with blood Hg levels ≥5.0 μg/L
Fish intake was evaluated, and the patients were asked to reduce the intake by 50%. If the patients consumed fish twice a week, they were instructed to reduce the intake to once a week or to consume half of their usual intake. Even if patients consumed fish less than once a week, they were still asked to reduce their intake by 50%. Moreover, if the patients ate less quantity of fish, they were still asked to reduce their intake of fish and shellfish by 50% after evaluating the usual amount of fish and shellfish that they consume.
2) In patients with blood Cd levels ≥1.4 μg/L
Shellfish intake was assessed and the patients were asked to reduce the intake by 50%. If the patients consumed shellfish twice a week, they were instructed to reduce the intake of shellfish once a week or to consume half of their usual intake. Even if patients consumed shellfish less than once a week, they were still trained to reduce their intake by 50%. If the patients ate less quantity of fish or did not eat red meat more than once a week, the current intake of red meat was increased by 50% or the intake was doubled.
4. Analysis of blood Cd and Hg concentration
Blood levels of Cd and Hg were measured at study initiation and 1 year later. In order to prevent clotting in blood samples, venous blood was obtained using 3-mL vacutainers (Beckton and Dickton) treated with ethylenediaminetetraacetic acid. A direct Hg analyzer (MA3000, NIC) was used to analyze the total blood Hg levels. To create a calibration curve, four reference samples including total blood (Hg 0.5–10 ppb) were prepared by diluting a standard solution (Waco Co.). When the linearity (r) of the calibration curve was less than 0.998, re-analysis was performed. The limit of detection was estimated to be 0.0021 ng. The analytical method of gold amalgamation was applied to determine the total Hg level in the blood according to the U.S. Environmental Protection Agency Method 7473 [14]. Commonly used standard agents were used to ensure the internal quality control and management of heavy metals: Whole Blood Metal Control Levels 1 and 2 (Seronorm, SERO AS) for measuring Hg levels in the blood. As a proof of external quality control and management, certifications for the analysis of total blood Hg levels were secured from the German External Quality Assessment Scheme (G-EQUAS) of Friedrich-Alexander University. Graphite furnace atomic absorption spectrometry with Zeeman background correction (900Z, Perkin-Elmer) was applied to determine the total Cd levels in the blood. To create a calibration curve, four reference samples including Cd in blood (0.5–4 ppb) were prepared by diluting a standard solution (SPEX CertiPrep). When the linearity (r) of the calibration curve was less than 0.998, re-analysis was performed. Commonly used standard agents were used to ensure the internal quality control and management of heavy metals: Whole Blood Metal Control Level 1 (Seronorm, SERO AS) and ClinChek Whole Blood Control Levels 1 and 2 (RECIPE Chemical) for blood Cd. As a proof of external quality control and management of heavy metals, certifications for the analysis of total blood Cd levels were secured from the G-EQUAS of Friedrich-Alexander University.
5. Laboratory measurements
Serum levels of blood urea nitrogen, creatinine, albumin, hemoglobin, calcium, and phosphorus were checked at the beginning and end of the study in pre-dialysis and dialysis patients. Proteinuria was measured from random spot urine.
6. Statistical analysis
Data are presented as mean±standard deviation, median (interquartile range), or frequency as appropriate. The nonparametric Wilcoxon signed-rank test was conducted to compare the baseline data with the data at 1 year. Statistical significance was set when the p-value was less than 0.05. The SPSS version 18.0 software (SPSS inc.) was used for statistical analysis.
Results
1. Baseline characteristics and biochemical data
Among the 27 CKD patients, four dropped out from the study and one withdrew consent. Twenty-two patients completed the trial within 1 year after receiving dietary education. The average age of patients was 64.3±9.9 years, 36.4% were male, 31.8% had DM, and 81.8% had hypertension. Six patients had a blood Cd level ≥1.4 μg/L and a blood Hg level ≥5.0 μg/L. Of the 15 pre-dialysis patients (63.6%), 14 had CKD stages 2–4, while one had CKD stage 5 without undergoing dialysis. Of the seven dialysis patients (36.4%), six underwent HD, while one underwent peritoneal dialysis.
The serum creatinine levels after 1 year were significantly increased, while the estimated glomerular filtration rate (eGFR) were significantly decreased compared with the baseline levels (Table 1). There were no patients with acute kidney injury. The blood Cd and Hg levels after 1 year were significantly decreased compared with the baseline levels in patients who completed this study (Fig. 1A).
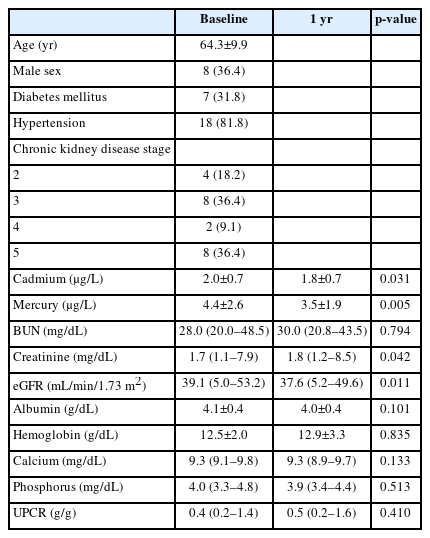
Clinical characteristics and changes in the biochemical data of enrolled patients with chronic kidney disease (n=22)
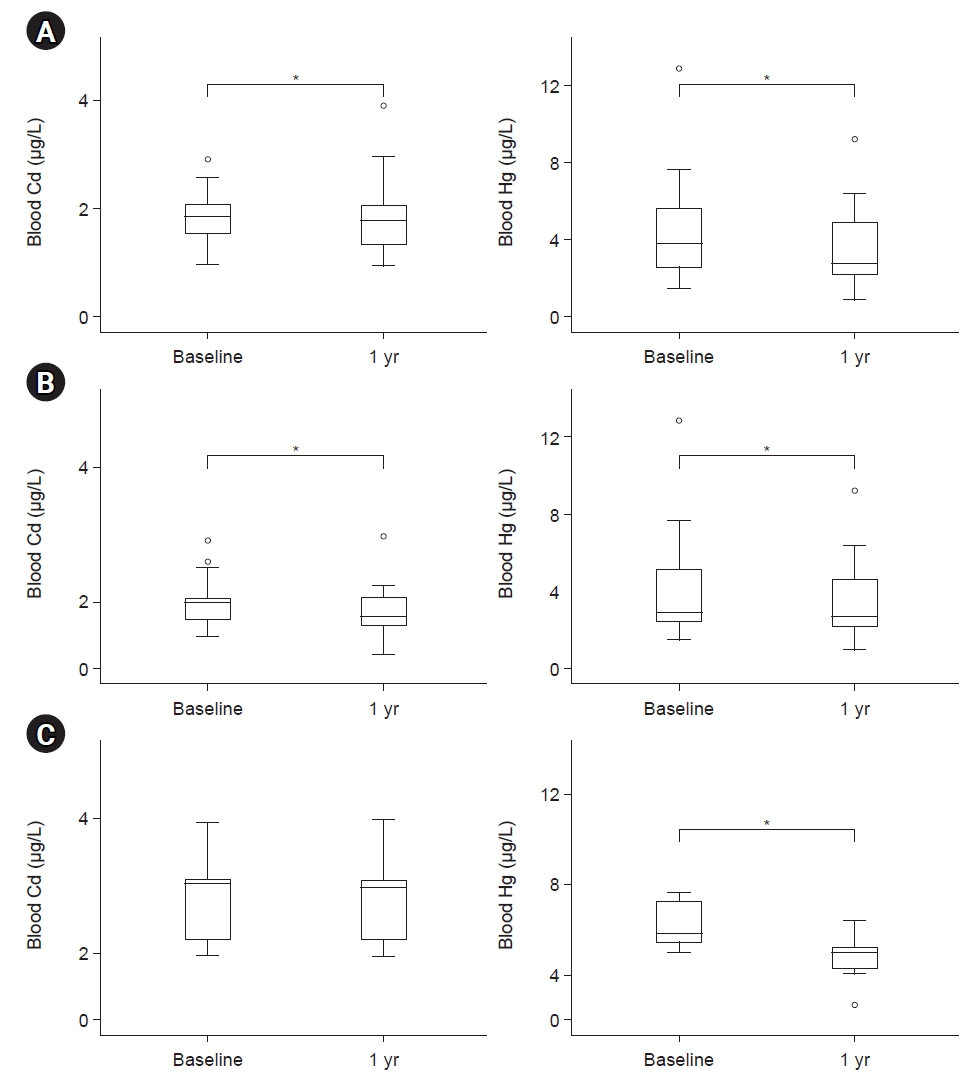
Changes in blood cadmium (Cd) and mercury (Hg) levels. (A) After dietary education in patients with chronic kidney disease (CKD; n=22). (B) After dietary education in CKD patients with Cd >1.4 μg/L (n=19). (C) After dietary education in CKD patients with Hg >5.0 μg/L (n=9). *p<0.05 (mean values were significantly different from baseline).
2. Changes in diet
For patients who completed this study, total calories and intake of each nutrient were analyzed at baseline and after 1 year of dietary education (Supplementary Table 1). No significant difference was observed in the nutrition status between the time points “before” and “1 year after dietary education.” However, dietary restrictions, such as consumption of fish and shellfish, have been imposed, presumably due to the reduced intake of animal protein and overall nutrients after a year.
3. Changes in biochemical data Laboratory measurements
In patients with blood Cd levels ≥1.4 μg/L (n=19), the blood Hg and Cd levels after 1 year of dietary education were significantly decreased compared with baseline levels (Table 2, Fig. 1B). Dietary intakes were not different at baseline and after 1 year of dietary education, but the eGFR after 1 year were significantly decreased compared with the baseline levels in patients with blood Cd levels ≥1.4 μg/L.

Changes in the biochemical data and dietary consumption of foods and nutrients in chronic kidney disease patients with cadmium levels ≥1.4 μg/L (n=19)
In pre-dialysis patients with blood Cd levels ≥1.4 μg/L (n=12), the blood Cd levels after 1 year were not significantly decreased, but the Hg levels after 1 year of dietary education were significantly decreased compared with the baseline levels; however, no significant difference was observed in terms of dietary intake (Supplementary Table 2). On the contrary, the serum creatinine and eGFR levels after 1 year of dietary education were significantly worse than the baseline levels. In dialysis patients, no significant difference was observed in the dietary intake as well as blood Cd and Hg levels after 1 year of dietary education compared with the baseline levels (Supplementary Table 3). In patients with blood Hg levels ≥5.0 μg/L (n=9), the blood Hg levels after 1 year were significantly decreased, but the Cd blood levels were not different compared with the baseline levels (Table 3, Fig. 1C). Although dietary intakes were not different at baseline and after 1 year of dietary education, renal function was not worse compared with that at baseline in patients with blood Hg levels ≥5.0 μg/L.
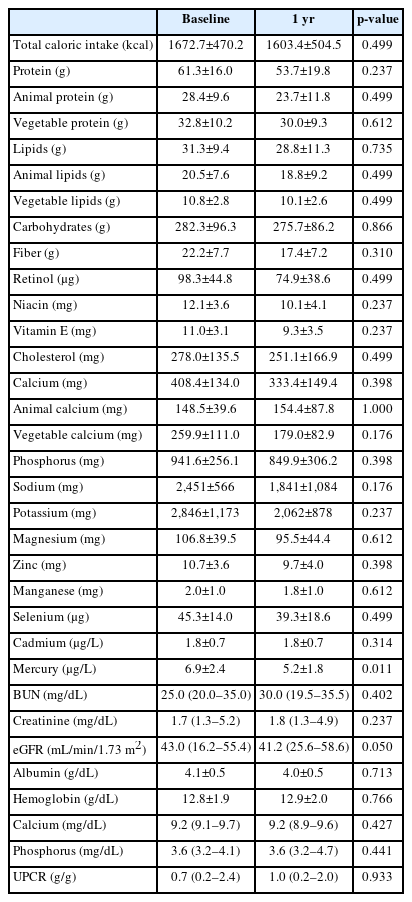
Changes in biochemical data and dietary consumption of foods and nutrients in chronic kidney disease patients with mercury levels ≥5.0 μg/L (n=9)
Discussion
We found that dietary education to reduce fish and shellfish intake helped decrease the blood Cd and Hg levels in this pilot study. Generally, heavy metals accumulate in the body and are not removed from the body tissues. However, this study suggests the possibility of reducing Cd and Hg from the body tissue or at least not increasing human body accumulation by avoiding Cd- and Hg-containing foods. The Korea National Environmental Health Survey and Korea National Health and Nutrition Examination Survey (KNHANES) reported a heavy metal age-standardized geometric mean (GM) for blood Hg of 3.64 µg/L in 2008, which decreased to 2.92 µg/L in 2017 [15]. Based on the KNHANES data, the blood Cd levels of the general population also decreased from 0.93 µg/L in 2008 to 0.77 µg/L in 2017 [16]. These data also support that monitoring and correct handling of heavy metals may affect the blood Cd and Hg levels in the general population despite the wide distribution and accumulation of Cd and Hg in the environment. This pilot study demonstrated that reduction in the consumption of fish or shellfish may reduce the blood Cd and Hg levels even in CKD patients with reduced heavy metal excretion.
Previous studies have shown that the GM of blood Hg levels was higher according to seafood intake, indicating an increase in Hg exposure [17,18]. Schober et al. [19] showed that the lowest Hg levels were found in the study group that did not consume seafood, and higher Hg levels were found in the study group that consumed seafood in the last 30 days. In Korea and Central Italy, the levels of Cd in the internal organs and tissues of shellfish, such as gastropod species, bay scallop, and comb pen shell were extremely high compared with those of Hg and Pb [20,21]. Hence, when eating shellfish, the internal organs must be removed to reduce Cd exposure. Both blood Cd and Hg levels were significantly reduced after 1 year in patients with blood Cd levels ≥1.4 μg/L. However, only blood Hg levels were significantly reduced, while the blood Cd levels remained unchanged after 1 year in patients with blood Hg levels ≥5.0 μg/L. Patients with blood Cd levels ≥1.4 μg/L were advised to reduce shellfish intake, while those with blood Hg levels ≥5.0 μg/L were advised to reduce intake of fish, such as mackerel. Although it is difficult to conclude that reducing shellfish intakes is more efficient in lowering Cd and Hg levels than reducing fish intakes, further studies are needed to identify various factors, including foods that can affect heavy metal levels.
In this study, the blood Cd levels of enrolled CKD patients were higher than those of the general population based on the KNHANES data. Renal elimination of Cd is extremely slow, especially in CKD patients with low GFR. It is not surprising that the blood Cd levels of CKD patients in the pre-dialysis group with Cd levels ≥1.4 μg/L were higher than those of non-CKD and CKD patients in the 2011 KNHANES V-2 [6]. Cd can accumulate in the liver and kidney and may affect the functions of the kidney. Metallothioneins (MTs) are synthesized in the liver to form the Cd–MT complex. The Cd–MT complex filtered from the glomerulus and reabsorbed in segment 1 and segment 2 of the proximal tubules [22]. Cd has a long half-life, and nearly 50% of Cd accumulates in the kidney; the accumulated Cd reduces the GFR and induces tubular dysfunction [23,24]. Nephrotoxic Hg dose induces acute kidney injury with extensive tubular necrosis and tubular dysfunction in a CKD rat model with less residual renal function [25,26]. Therefore, patients with CKD are susceptible to the nephrotoxic effects of Hg. In this pilot study, the blood Hg levels of enrolled CKD patients were similar to those of non-CKD and CKD patients in the 2011 KNHANES V-2 [6]. The blood Hg levels may not be nephrotoxic even in CKD patients with blood Hg levels ≥5.0 μg/L. However, chronic exposure to higher Cd and Hg levels may lead to insults in CKD patients; hence, dietary education trials aimed at reducing the exposure to Cd and Hg may be helpful in improving the kidney health of CKD patients.
It is peculiar that renal function based on eGFR (−2.7 mL/min/1.73 m2 per year) was significantly reduced after 1 year compared with that at baseline in pre-dialysis CKD patients with blood Cd levels ≥1.4 μg/L despite the reduction in blood Cd and Hg levels. Kidney Disease: Improving Global Outcomes guideline defines CKD as rapid progression when eGFR continuously decreases by more than 5 mL/min/1.73 m2 per year [27]. The rate of renal function reduction varies according to the severity of proteinuria and the presence of DM. In general, a GFR decline of approximately 0.3–1 mL/min/1.73 m2 per year is common among participants without proteinuria or comorbidity, and the deterioration in renal function is about two to three times faster among participants with proteinuria or comorbidities [28,29]. Factors such as age, diabetes, proteinuria, and hypertension of patients included in this study are considered to be factors of deterioration of renal function. Also, these patients had higher Cd and Hg levels, to these parts may have affected the deterioration of renal function. Blood Cd and Hg levels can indicate a relatively recent exposure and chronic exposure history [30]. Therefore, the recent reduction in blood Cd and Hg levels may not necessarily delay the progression of renal disorder. In other words, chronic exposure to Cd, which increases the blood Cd levels to ≥1.4 μg/L, may exacerbate the GFR decline in CKD patients with blood Cd levels ≥1.4 μg/L after 1 year. Reducing Cd level can be assumed that it can delay the deterioration of renal function, not preventing deterioration of renal function. This short-term study may give hint to removing additional risk factor of decreasing renal function. Besides Ca and Hg exposure, various environmental contaminants such as lead and arsenic cause deterioration of organ damage including kidney and liver. Hence, long-term clinical studies are necessary to determine nephrotoxic levels of heavy metals in the blood and reducing effect of heavy metals for renal protection.
Our study has some strengths. First, this prospective study evaluated the changes in blood Cd and Hg levels after dietary education. Several previous studies were usually cross-sectional designs and investigated the levels of Cd and Hg in blood in association with the amount of fish and shellfish consumed. Second, this study demonstrated that CKD patients were susceptible to Cd and Hg exposure.
There are some limitations to this study. First, this study included a relatively small number of patients and had a follow-up period of only 1 year. Second, the enrolled CKD patients were mixed according to CKD stage and dialysis status. Third, we did not assess the Cd levels in the urine or inorganic or organic Hg levels; we only evaluated the Cd and Hg levels in the blood after provision of dietary education. Fourth, a semiquantitative food frequency questionnaire was used to evaluate the patients’ diet at baseline and 1 year after provision of dietary education. It was not monitored using objective indicators to identify whether dietary education was being conducted properly at every visit.
Dietary education to reduce food intake containing Cd and Hg may help lower the blood Cd and Hg levels in CKD patients with higher blood Cd and Hg levels. Further studies are necessary to determine whether active dietary education and interventions are helpful not only in patients with CKD but also in the general population with higher blood Cd and Hg levels. Still, higher blood Cd levels may affect renal progression in pre-dialysis CKD patients, and further large-scale studies are necessary to confirm this result.
Supplementary material
Supplementary materials are available at https://doi.org/10.7180/kmj.23.101
Supplementary Table 1. Changes of dietary consumption of foods and nutrients in enrolled patients with chronic kidney disease (n=22)
Supplementary Table 2. Changes of biochemistry data and dietary consumption of foods and nutrients in pre-dialysis CKD patients with cadmium levels ≥1.4 μg/L (n=12)
Supplementary Table 3. Changes of biochemistry data and dietary consumption of foods and nutrients in dialysis patients (n=7)
Notes
Conflicts of interest
No potential conflict of interest relevant to this article was reported.
Funding
This work was supported by grants from the Environmental Health Center, funded by the Ministry of Environment, Republic of Korea.
Author contributions
Conceptualization: WSA. Data curation: SML, YSH, BGK, JYK, YP, SEK, WSA. Methodology: SML, YSH, BGK, JYK, YP, SEK, WSA. Formal analysis: SML, WSA. Supervision: SML, YSH, BGK, JYK, YP, SEK, WSA. Writing – original draft: SML, WSA. Writing – review & editing: SML, WSA. Approval of final manuscript: all authors.