Correlation of long interspersed element-1 open reading frame 1 and c-Met proto-oncogene protein expression in primary and recurrent colorectal cancers
Article information

Abstract
Background
Colorectal cancer is one of the most common cancers worldwide. Colorectal cancer that has recurred and metastasized to other organs also has a very poor prognosis. According to recent studies, the long interspersed element-1 (LINE-1) retrotransposon open reading frame (ORF) is located in the intron of the c-Met proto-oncogene, which is involved in cancer progression and metastasis, and regulates its expression. However, no study has compared the expression patterns of LINE-1 ORF1 and c-Met, which are closely related to cancer progression and metastasis, and their correlation in primary and recurrent cancers.
Methods
In the present study, we compared the expression patterns of LINE-1 ORF1 and c-Met in both primary and recurrent colorectal cancer tissues from 10 patients. Expression patterns and correlations between LINE-1 ORF1 and c-Met proto-oncogene proteins were analyzed by immunofluorescence staining using both LINE-1 ORF1 and c-Met antibodies.
Results
The expression patterns of LINE-1 ORF1 and c-Met showed significant individual differences, and the expression of both proteins was correlated in all colorectal cancer patients. However, the expression levels of LINE-1 ORF1 and c-Met were not significantly different between primary and recurrent colorectal cancers.
Conclusions
The protein expression levels of LINE-1 ORF1 and c-Met were correlated, but did not change significantly in cases of recurrent colorectal cancer in the same patient.
Introduction
Colorectal cancer is the third most common cancer in the world, after lung and breast cancer [1-4]. The prevalence rate of people under 50 years is low, but older people tend to have an increased prevalence rate closely related to Westernized eating habits [3,4]. Most colorectal cancers are difficult to completely cure, and recurrences often occur [4]. Metastatic recurrent colorectal cancer usually appears in the liver, lung or in the pelvis and peritoneum with severe symptoms [5].
Recent studies have shown that transposable elements account for 45% of the total human genome. In particular, long interspersed element-1 (LINE-1 or L1) accounts for 16% to 20% and is associated with the development of cancer [6-8]. LINE-1 consists of a 5′-untranslated region (UTR), a 3′-UTR and two types of open reading frames (ORFs) translated into protein [6,9-11]. ORF1 encodes ~40 kDa nucleic acid binding protein (ORF1p) [12-16] with nucleic acid chaperone activity [16,17]. ORF2 encodes a ~150 kDa protein (ORF2p) with DNA endonuclease [18] and reverse transcriptase activity [19,20].
LINE-1 is used as a representative measurement of DNA methylation of the entire genome as it belongs to the retrotransposon that exists in the whole human genome [9-11,21,22]. Hypomethylation of LINE-1 has been studied intensively, observed in almost all cancer types, and can be a hallmark of many human cancers [23,24]. LINE-1 hypomethylation induces the activation of proto-oncogenes in human colorectal cancer metastasis. Hypomethylation of LINE-1 is increased in cancer metastasis [7]. Specifically, the activation of proto-oncogene c-Met is involved in liver metastasis of colorectal cancer patients [7]. Moreover, the transcripts of LINE-1 are distributed throughout the genome, and c-Met also contains LINE-1 transcripts [25]. c-Met is over-expressed in colorectal cancer metastases; it was reported that it is regulated by hypomethylation of the internal anti-sense promoter of LINE-1 rather than the promoter site of colorectal cancer metastasis [7,25].
A well-known oncogene, c-Met proto-oncogene located on chromosome 7 encodes the transmembrane tyrosine kinase, a receptor for hepatocyte growth factor (HGF) or scatter factor (SF) [22,25-33]. When c-Met is activated by binding with a ligand (HGF or SF), it induces various cell reactions such as cell proliferation, motility, scattering, and invasion [28,34-38]. It can also induce invasion through biological effects on epithelial cells [28,30,36]. Based on this knowledge, the c-Met/ligand complex is considered to control the growth and migration of various epithelial cancers [28,29,32,33,35,37,38]. In addition, the c-Met proto-oncogene is over-expressed in cancer and is thought to be an important biomarker [28,32,33,36-38].
There have been many previous studies on LINE-1 and c-Met. Most were comparisons of protein expression levels and patterns between normal and cancer tissues. These relationships in primary and recurrent cancers derived from the same patient, however, are poorly understood. In this study, we analyzed LINE-1 ORF1 and c-Met proto-oncogene expression levels in both primary and recurrent colorectal cancer tissues from 10 patients.
Methods
Ethical statements: This study was approved by the Institutional Review Board of Kosin University Gospel Hospital (IRB No. KUGH IRB 11-60). Each patient involved in the study provided written informed consent.
1. Patient sample
Primary and recurrent cancer paraffin slides from 10 colorectal cancer patients were obtained from the Department of Pathology, Kosin University Gospel Hospital. Personal information such as age, sex, cancer region, and surgery date is presented in Table 1.
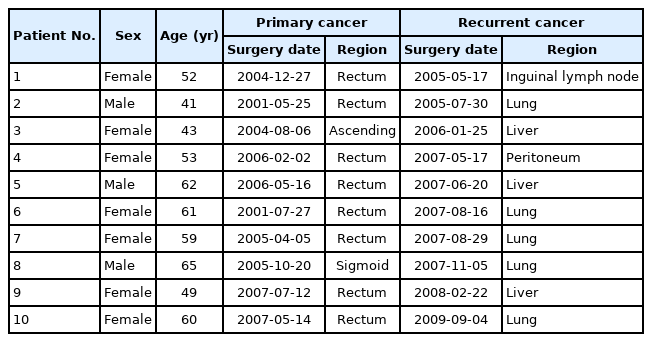
Patient information
2. Immunofluorescence analysis
For immunofluorescence analysis, paraffin slides of 10 patient samples were dried at 60℃ for 1 hour. After that, xylene and ethanol were used to deparaffinize and hydrate the slides. They were then immersed in a citrate buffer (0.01 M, pH 6.0) for antigen retrieval, and heated for 10 minutes in a microwave (700 W or higher) three times. A Dako pen (Dako Denmark, Glostrup, Hovedstaden, Denmark) was used around the cancer tissue to prevent the solution from escaping. To block nonspecific antibodies, slides were treated with 5% fetal bovine serum in 1X phosphate buffered saline (PBS) for 1 hour. After treatment, slides were incubated with anti-LINE-1 ORF1p (1:1,000 dilution; EMD Millipore Corp., Temecula, CA, USA), a mouse monoclonal antibody, and anti-Met (c-Met) antibody (1:500 dilution; Abcam, Cambridge, UK), a rabbit monoclonal antibody, overnight at 4℃. They were then washed three times with 1X PBS for 5 minutes. After that process, slides were incubated with goat anti-mouse secondary antibody Alexa Fluor 546 (1:1,000 dilution; Invitrogen, Carlsbad, CA, USA) and donkey anti-rabbit secondary antibody Alexa Fluor 488 (1:1,000 dilution, Invitrogen) for 1 hour. They were then washed three times with 1X PBS for 5 minutes. For nuclear staining, slides were incubated with Qnuclear Deep Red stain (1:1,000 dilution, Invitrogen) for 20 minutes, then washed four times with 1X PBS for 5 minutes. Specimen epifluorescence was confirmed using a confocal laser scanning microscope (LSM 510 META; ZEISS, Atlanta, GA, USA). The specificity of each antibody was confirmed by staining of mouse polyclonal IgG and rabbit polyclonal IgG. Confocal images were used for measuring fluorescence intensity with image analysis software AlphaEase FC (Alpha Innotech, Randburg, Gauteng, South Africa).
3. Statistical analysis
The statistics were calculated by patient’s experimental results. Fluorescence images were analyzed using AlphaEase FC and image intensity was used for calculation of mean values and 95% confidence intervals. Both values were compared using two-tailed Student t-test. p-values <0.05 were considered statistically significant. Correlation of protein expression was confirmed by SPSS 27 software (IBM Corp., Armonk, NY, USA).
Results
1. Expression patterns of LINE-1 ORF1 and c-Met
LINE-1 ORF1 and c-Met proto-oncogene protein expression were confirmed in 10 pairs of patient colorectal cancer samples by immunofluorescence staining (Fig. 1). Each patient’s slide contained primary and recurrent colorectal cancers from the same patient. Immunofluorescence staining image analysis showed that the expression patterns of LINE-1 ORF1 and c-Met varied among patients. Patients 1, 6, 7, 8, and 10 had high expression of c-Met in the recurrent group, and patients 2, 3, 4, 5, and 9 had high expression of c-Met in the primary group. Patients 1, 2, 5, 6, and 10 had high expression of LINE-1 in the recurrent group, and patients 3, 4, 7, 8, and 9 had high expression of LINE-1 in the primary group. These results indicate that the expression pattern is specific to each individual. Expression levels were consistent in both primary and recurrent colorectal cancers from the same patient (Fig. 2).

Expression patterns of LINE-1 (L1) ORF1 and c-Met in each patient. The 10 patient colorectal cancer sample slides underwent immunofluorescence analysis. For each patient, two samples were used: primary and recurrent colorectal cancers. Ten spots were captured in each slide. Images were captured with LSM510 software at ×400 magnification. LINE-1, long interspersed element-1 retrotransposon; ORF, open reading frame.

Expression levels of LINE-1 ORF1 and c-Met in each patient’s primary and recurrent colorectal cancer sample. The horizontal axis of the graph is patient number, and the vertical axis is the expression level confirmed by the integrated density value (IDV) of the image. (A) Expression of LINE-1 ORF1 in each patient. (B) Expression of c-Met in each patient. LINE-1, long interspersed element-1 retrotransposon; ORF, open reading frame.
2. LINE-1 ORF1 and c-Met protein expression in primary and recurrent colorectal cancer
Based on immunofluorescence staining analysis, the integrated density value was calculated and plotted as a graph (Fig. 3). When the expression of the LINE-1 ORF1 and c-Met proteins in primary and recurrent colorectal cancers was compared in the same patient, overall patterns were similar (Fig. 3).
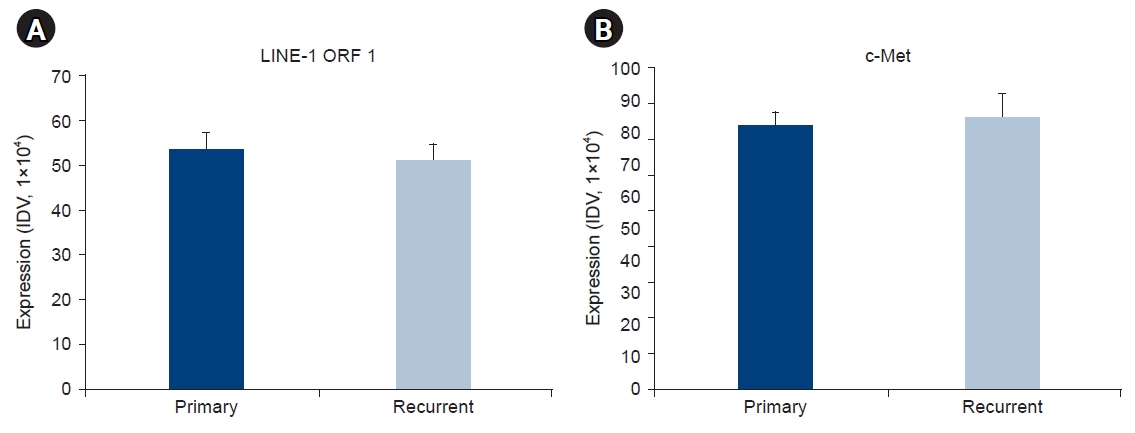
Overall expression patterns of LINE-1 ORF1 and c-Met in primary and recurrent colorectal cancers. The horizontal axis of the graph indicates either primary or recurrent colorectal cancer, and the vertical axis is the level of expression confirmed by the integrated density value (IDV) of the image. (A) Expression of LINE-1 ORF1 in primary and recurrent colorectal cancer. (B) Expression of c-Met in primary and recurrent colorectal cancer. LINE-1, long interspersed element-1 retrotransposon; ORF, open reading frame.
3. Correlation between LINE-1 ORF1 and c-Met expression
Although the expression levels of LINE-1 ORF1 and c-Met varied among patients, the expression of LINE-1 ORF1 and c-Met were correlated with each other (Fig. 4). On correlation analysis, LINE-1 ORF1 and c-Met protein expression were related to each other in three groups: primary (r=0.203, p<0.05), recurrent (r=0.233, p<0.05), and primary and recurrent (r=0.217, p<0.01) (Table 2).

Correlation analysis of LINE-1 ORF1 and c-Met expression patterns. The expression of LINE-1 ORF1 and c-Met was correlated in all panels. The correlation was calculated using SPSS software. (A) Correlation of LINE-1 ORF1 and c-Met expression in primary colorectal cancer. (B) Correlation of LINE-1 ORF1 and c-Met expression in recurrent colorectal cancer. (C) Correlation of LINE-1 ORF1 and c-Met expression across all colorectal cancers. IDV, integrated density value; LINE-1, long interspersed element-1 retrotransposon; ORF, open reading frame.

Correlation of LINE-1 ORF1 and c-Met protein expression in primary and recurrent colorectal cancer
Discussion
LINE-1 is one of the most abundant mobile genetic elements in the human genome and it acts as retrotransposon [9,11,21,22]. Activated LINE-1 causes modification of the original DNA sequence, which negatively affects the stability of the chromosome [6]. Thus, LINE-1 can contribute to the genomic instability that is characteristic of cancer. Moreover, LINE-1 elements are distributed throughout the genome and may affect the expression of marginal genes. A recent study showed that LINE-1 sequences inserted into the c-MET gene intron between exons 2 and 3 and LINE-1 hypomethylation affected c-MET proto-oncogene expression [18,25,39]. A well-known proto-oncogene, c-MET is located on chromosome 7 and is over-expressed in cancer; thus, it has been suggested to be a cancer biomarker [22,25,26,29-33]. LINE-1 and the c-MET proto-oncogene are closely related to cancer and their protein expression levels have been reported to be upregulated in many cases [23,35].
In this study, LINE-1 ORF1 and c-MET proto-oncogene protein expression levels and expression patterns were analyzed in primary and recurrent colorectal cancer patient samples. We investigated the correlation between the LINE-1 ORF1 and c-Met protein expression in individual patients. Previous reports suggested that LINE-1 ORF1 hypomethylation and c-MET expression are highly related to tumor malignancy and metastatic potential [7]. However, the expression patterns of LINE-1 ORF1 and c-MET protein expression were similar in recurrent cancer compared with primary cancer. The expression pattern of both proteins exhibited individual patterns, meaning that expression varies by patient but is preserved in recurrent cancers in the same patient (Figs. 2, 3). LINE-1 ORF1 and c-Met protein expression were significantly correlated (Table 2, Fig. 4). However, Pearson correlation coefficients were weak. These data suggested that LINE-1 ORF1 and c-Met levels are correlated, but other factors may be involved in regulation of c-Met protein expression. Because this study only examined the whole LINE-1 ORF1 protein in colorectal cancer samples, the expression pattern of specific LINE-1 ORF1 interspersed c-Met genome constructs should be evaluated in the future.
In conclusion, protein expression levels of LINE-1 ORF1 and c-Met were not significantly different between primary and recurrent colorectal cancers in the same patient. There were interindividual differences in protein expression, while intraindividual patterns were consistent. The expression of both LINE-1 ORF1 and c-Met protein was correlated.
Notes
Conflicts of interest
Hee-Jae Cha is an editorial board member of the journal but was not involved in the peer reviewer selection, evaluation, or decision process of this article. No other potential conflicts of interest relevant to this article were reported.
Funding
This work was supported by a National Research Foundation Grant funded by the Korean Government (NRF-2016R1D1A3B01007444).
Author contributions
Conceptualization: KYJ. Data curation: EJK. Formal analysis: KYJ. Funding acquisition: HJC. Methodology: KYJ, EJK, HKC, SHL, BKA. Project administration: MSO, HJC. Visualization: EJK, HJC. Writing - original draft: KYJ, HJC. Writing - review & editing: EJK, HKC, SHL, BKA, MSO, HJC. Approval of final manuscript: all authors.