The Natural Course of Total Kidney Volume in Patients with Autosomal Dominant Polycystic Kidney Disease undergoing Hemodialysis
Article information
Abstract
Objectives
The natural course of native kidneys after hemodialysis initiation in patients with autosomal dominant polycystic kidney disease (ADPKD) remains poorly understood.
Methods
We measured the total volumes of native kidneys in 12 patients who had at least one enhanced computed tomography (CT) image both before and after initiation of hemodialysis (group 1) and in 18 patients who had no image before dialysis but more than two images after dialysis (group 2). In patients with images, the last image was used for analysis only after dialysis.
Results
The mean total kidney volume (TKV) (± SD) before hemodialysis initiation was 3132 ± 1413 mL and the mean TKV of the last image was 3047 ± 1323 mL in group 1. The mean TKV change rate (%) was −5.2 ± 27.4% (P > 0.05) during follow-up of 3.9 ± 1.9 years in group 1. The mean TKV change rate was 2.8 ± 34.4% (P > 0.05) in group 2. The follow-up period after dialysis initiation ranged from 4.2 ± 4.7 to 8.0 ± 5.2 years.
Conclusions
The results suggest that the TKV of native polycystic kidneys decreases substantially after hemodialysis initiation. This reduction occurs mainly during the early post-hemodialysis period and followed by a slow enlargement of TKV.
Autosomal dominant polycystic kidney disease (ADPKD) is one of the most common genetic disorders that are accompanied by both renal clinical conditions such as decreased renal function, hematuria, kidney stones, and cystic infection and extrarenal clinical conditions such as hypertension, hepatic cysts, cerebral aneurysm, and cardiac valvulopathies.1,2 Additional problems such as chronic pain and abdominal distension occur if nephromegaly gets worse as the kidney cysts enlarge and expand. In addition, patients undergoing dialysis with severe abdominal distension require nephrectomy or kidney transplantation in order to treat its complications.3
In patients with ADPKD, the renal function declines as the number and size of kidney cysts increase. Moreover, it is known that the faster the kidney grows, the quicker its function deteriorates.4,5 However, it is not clear how the kidney volume changes during the dialysis period with a declining renal function. In patients with ADPKD, it is difficult to decide whether to perform nephrectomy of native polycystic kidneys due to the risks of complications. In addition, prior to kidney transplantation, it is sometimes difficult to determine whether to perform nephrectomy before or after the transplantation. If changes in kidney volume can be predicted during dialysis, it could be helpful for patients with ADPKD undergoing hemodialysis to decide when to undergo nephrectomy to solve the complications caused by kidney hypertrophy or whether to undergo nephrectomy before kidney transplantation to reserve space for the transplanted kidney. Studies about the natural course of changes in the total kidney volume (TKV) in patients with ADPKD undergoing hemodialysis will help determine the aforementioned cases in the future. Very few studies have examined this question.6–8 This study was designed to determine the natural course of native polycystic kidneys undergoing hemodialysis.
MATERIALS AND METHODS
In this retrospective study, we examined the change in TKV in patients diagnosed with ADPKD after hemodialysis initiation using medical records inquiry and radiographic imaging of both kidneys.
We examined 30 patients with ADPKD who had at least two contrast enhanced abdominal computed tomography (CT) images that completely include both kidneys. All patients were divided into two groups: one group had radiographic images both at least one before dialysis initiation and at least one after dialysis initiation (group 1), and the second group had at least two images after dialysis initiation (group 2). We excluded cases with a history of kidney transplant or nephrectomy prior to dialysis, major hemorrhage, or cyst infection. Pre-dialysis images were limited to those taken 24 months prior to the start of dialysis. This study was approved by the Kosin University International Review Board.
All Digital Imaging and Communications files obtained from contrast-enhanced CT images were thoroughly reviewed to ensure that they contained both kidneys and that the readings had adequate image quality prior to the study. TKV was evaluated by a single investigator without knowledge of the subject’s end-stage renal disease status and was determined from axial/coronal CT or MRI using Analyze software (AnalyzPro, Biomedical Imaging Resource, Mayo Clinic, Rochester, MN).
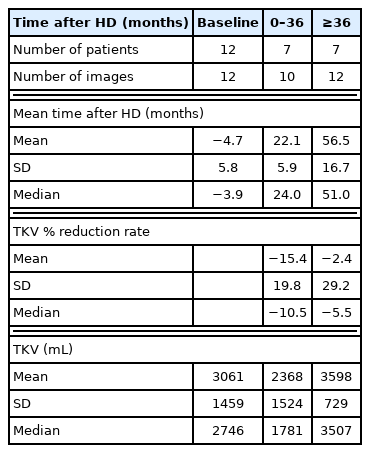
To measure the rate of change of TKV in each patient, the volumes of the first and the last images were used if there were more than two images. We categorized patients by the time interval of dialysis initiation and last follow-up images: 0, 0–36, and ≥ 36 months. The t-test was used to determine the significance of the difference between TKV values before and after dialysis initiation. The results were shown as mean ± SD. The statistical significance was defined as P < 0.05 and the analysis was conducted using SPSS (Version 25.0, Chicago, IL).
RESULTS
There were 12 patients (34 images) and 18 patients (49 images) in groups 1 and 2, respectively. In group 1, most patients were of 1E Mayo classifications based on baseline image. The mean values of TKV prior to hemodialysis and of the last image were 3132 ± 1413 mL and 3047 ± 1323 mL, respectively. The TKV change rate was −5.2 ± 27.4% during follow-up of 3.9 ± 1.9 years, however, there was no statistical significance (Table 1). The rate of change in TKV decreased by 15.4% and 2.4% before and after 36 months, respectively (P > 0.05) (Table 2) (Fig. 1A).
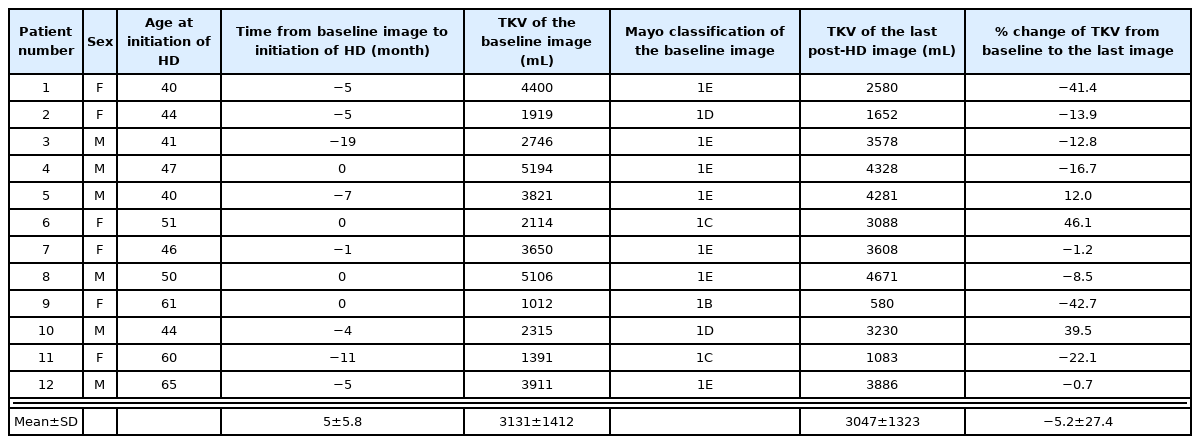
Demographic characteristics of ADPKD patients with pre- and at least one post-hemodialysis enhanced renal CT
TKV and TKV change from baseline to the time after hemodialysis in ADPKD patients who having enhanced renal CT both before and after dialysis initiation
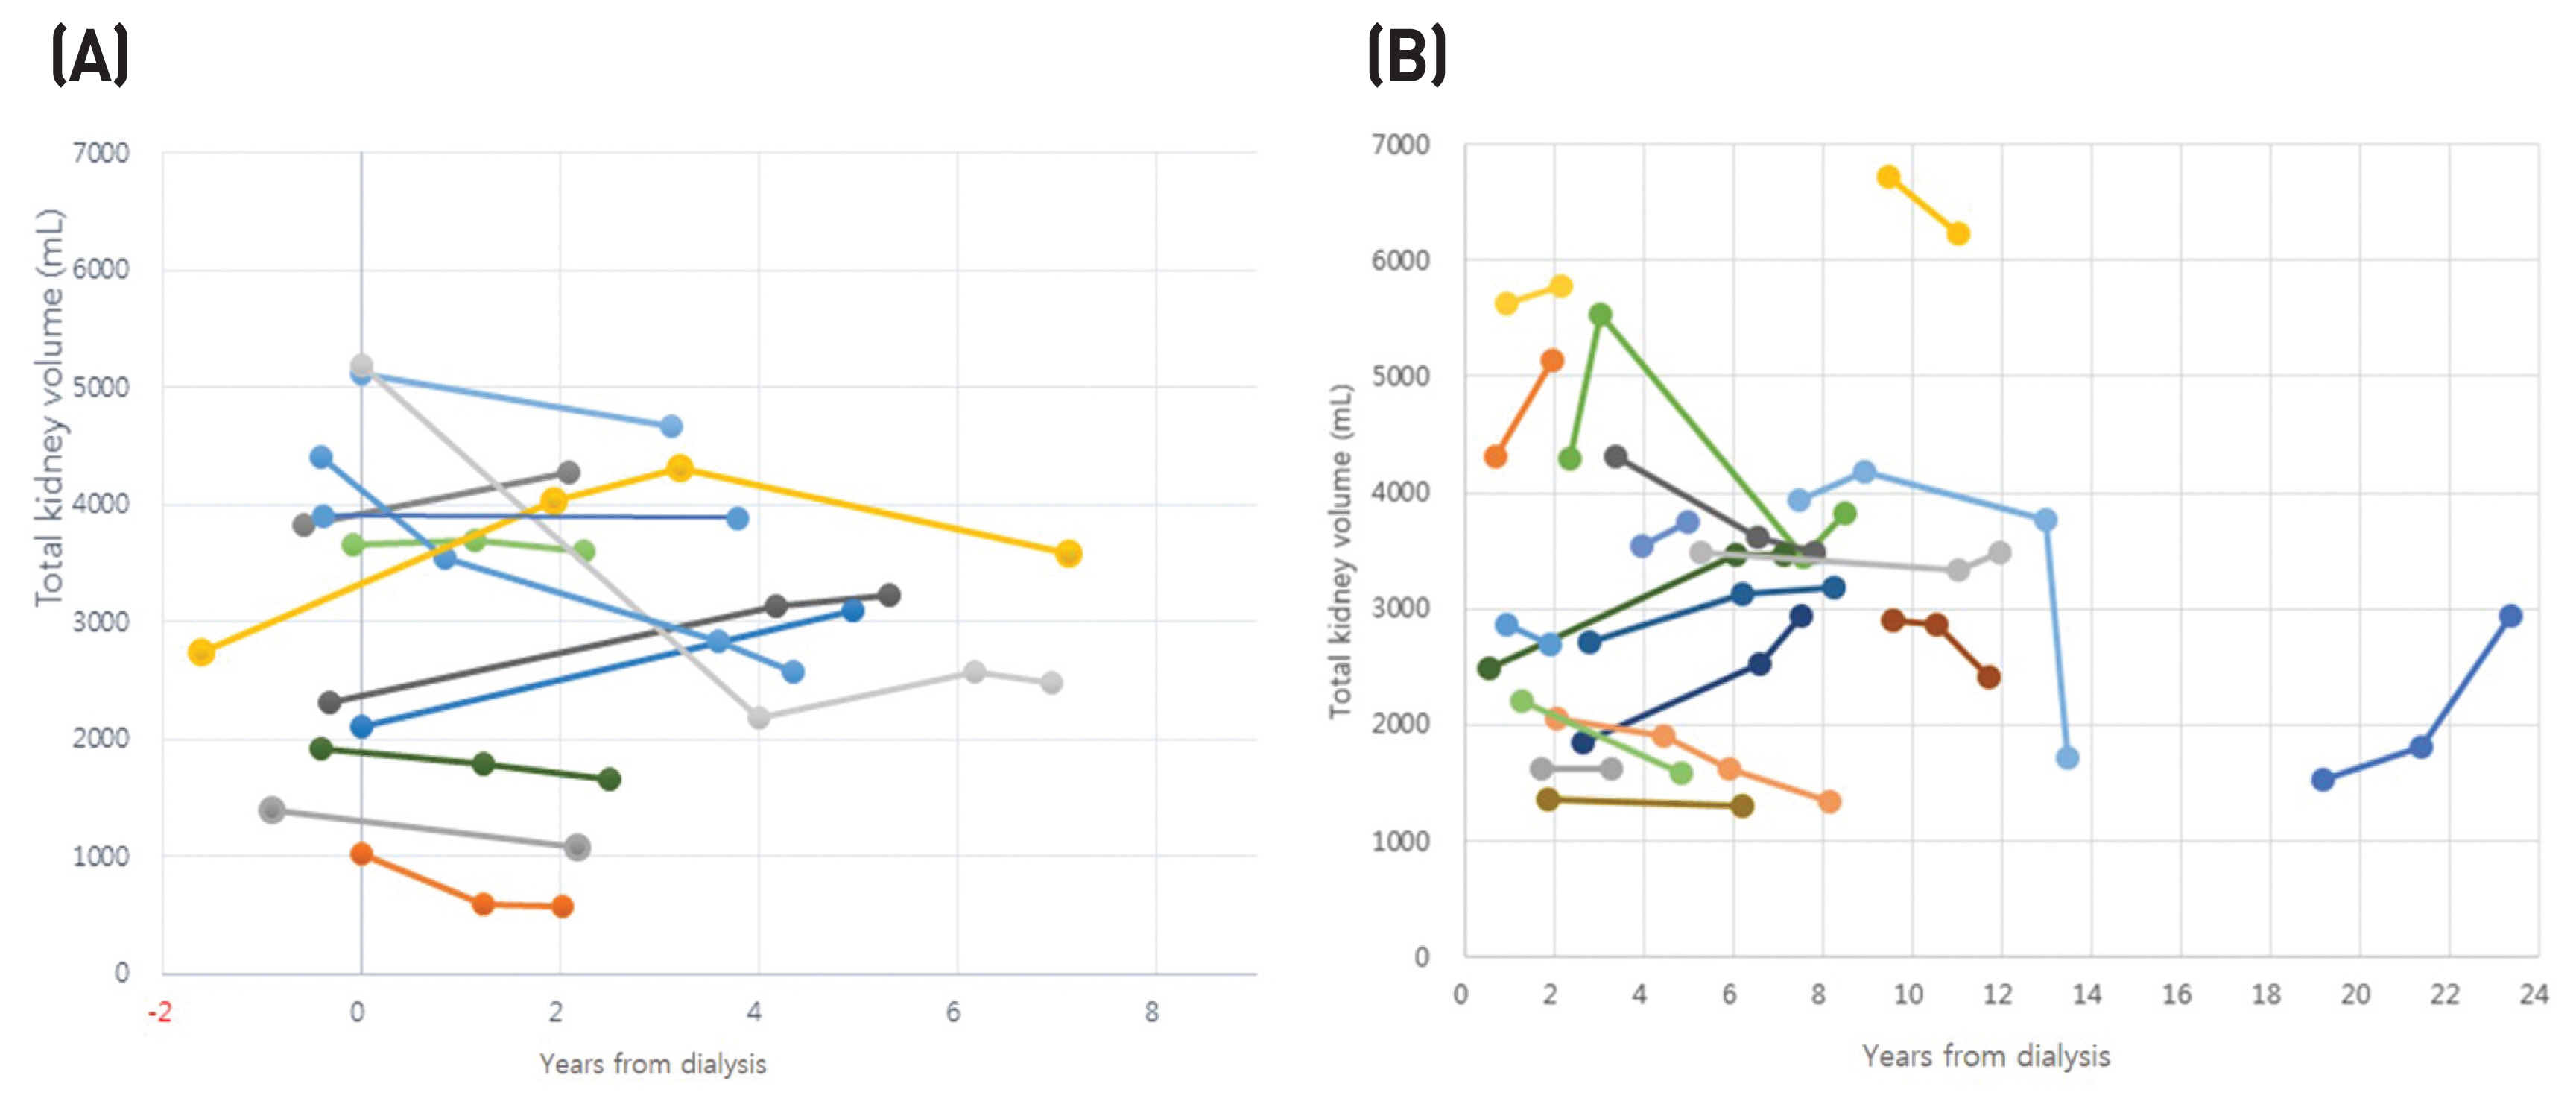
Change of native TKV in relation to years from dialysis. (A) Patients who had pre-and at least one post-dialysis image. (B) Patients who had only two or more post-dialysis images.
In group 2, the TKV rate of change increased by 2.8 ± 34.4%, but there was no statistical significance (P > 0.05). The post-dialysis follow-up period ranged from 4.2 ± 4.7 to 8.0 ± 5.2 years (Fig. 1B).
DISCUSSION
In patients with ADPKD, the continuous increase of TKV due to disease course is known to be associated with kidney failure; however, it is not clear how the TKV of polycystic kidneys changes after dialysis. There exists a variety of small clinical research on the changes in TKV after dialysis in patients with ADPKD. TKV decreases within 36 months after dialysis, which is a relatively short period, and then gradually increases again.6,7 On the other hand, a previous study showed various aspects of both increase and decrease in TKV.8 Another study reported an increase in TKV during dialysis in 9 patients; nonetheless, there was no statistical significance.9 In our study, 9 out of 12 patients in group 1 had a decrease in TKV after follow-up of 3.9 ± 1.9 years. When TKV and the rate of change of TKV are divided based on 36 months from the start of dialysis in our study, TKV is more likely to decrease in the early stages of hemodialysis, given that TKV change rates decreased by 15.4% in less than 36 months.
In patients with ADPKD, it is very important to determine when to perform nephrectomy of native kidneys if nephromegaly complications occur or if kidney transplant surgery is planned during dialysis. In addition, the decision whether to undergo nephrectomy is crucial because in some cases, nephrectomy is accompanied by significant complications in patients with ADPKD.3 Native polycystic kidneys tend to regress in volume after kidney transplantation.9 Therefore, if there is enough space in the abdominal area, nephrectomy is not necessary. It is reported that if patients with ADPKD undergo renal transplantation, the TKV of native kidneys decrease by 20–37% within the first year of transplantation.9,10 The shorter the dialysis period before the kidney transplantation and the better the kidney functions, the more effective the TKV reduction. Moreover, this is expected to contribute to the reduction in the growth of the tubular cells, perhaps due in part to the improvement of uremia and the reduction of the blood flow to the native kidneys. In this study, the TKV of the native kidneys decreased during the initial period, which is less than 36 months after dialysis, and is likely to have an effect on the improvement of uremia due to dialysis. Identifying the factors that affect the rate of change of TKV after dialysis treatment or renal transplantation is believed to be an important source of data to determine nephrectomy of enlarged kidneys in the future.
Even though the cause of acquired cystic kidney disease (ACKD) is not clearly known, the cystic fluid composition in ACKD is shown to be similar to plasma; therefore, it is believed that plasma is filtered and secreted into the cysts. Additionally, it is judged that the presence of brush border membranes in a cyst provides that the basis of the cyst comes from the growth of the proximal tubular cell.11,12 Furthermore, the activation of various growth factors is thought to be involved in the growth of the cysts as well as the proliferation of tubular cells.13,14 In patients with ADPKD, it is considered that there is a possibility that the mechanism of cyst formation in ACKD could contribute. In this study, the TKV rate of change in group 2 increased by 2.8 ± 34.4% (P > 0.05). There is a possibility that persistent uremia contributed to the growth of cysts during the long dialysis period. Further studies will be required to determine if the TKV in the kidney shows a statistically significant increase after dialysis.
In order to identify the factors affecting the change in TKV after a dialysis treatment or a kidney transplantation in future patients with ADPKD, it is necessary to conduct a prospective study on the change in TKV after a renal transplantation, which is parallel to the post dialysis treatment. This study was initially aimed to identify the factors affecting the changes in TKV after dialysis in patients with ADPKD; nevertheless, there were no statistically significant results due to the small sample size. However, this study is considered valuable as a basic research, given that it provides a basis for further research.
In conclusion, TKV of native kidneys in patients with ADPKD tends to decrease early in hemodialysis; however, it is likely to increase during long-term follow-up periods. In order to find out the cause of the changes of TKV in patients with ADPKD in the future, prospective studies after dialysis and kidney transplantation are needed.