Relation of Various Parameters Used to Estimate Cardiac Vagal Activity and Validity of pNN50 in Anesthetized Humans

Article information

Kosin Med J. 2018;33(3):369-379
Publication date (electronic) : 2018 January 19
doi : https://doi.org/10.7180/kmj.2018.33.3.369
Department of Anesthesiology and Pain Medicine, Ulsan University Hospital, College of Medicine, Ulsan University, Ulsan, Korea
Corresponding Author: In Young Huh, Department of Anesthesiology and Pain Medicine, Ulsan University Hospital, 877, Bangeojin sunhwan do-ro, Dong-gu, Ulsan 44033, Korea Tel: +82-52-250-7248 Fax: +82-52-250-7249 E-mail: huhiy@naver.com
Received 2017 November 21; Revised 2018 February 02; Accepted 2018 February 05.

Abstract

Objectives

Analysis of heart rate variability (HRV) has been used as a measure of cardiac autonomic function. According to the pNN50 statistic, the percentage of differences between successive normal RR intervals (RRI) that exceed 50 ms, has been known to reflect cardiac vagal modulation. Relatively little is known about the validity of pNN50 during general anesthesia (GA). Therefore, we evaluated the correlation of pNN50 with other variables such as HF, RMSSD, SD1 of HRV reflecting the vagal tone, and examined the validity of pNN50 in anesthetized patients. Methods: We assessed changes in RRI, pNN50, root mean square of successive differences of RRI (RMSSD), high frequency (HF) and standard deviation 1 (SD1) of Poincaré plots after GA using sevoflurane anesthesia. We also calculated the probability distributions for the family of pNNx statistics (x: 2-50 ms).

Results

All HRV variables were significantly decreased during GA. HF power was not correlated with pNN50 during GA (r = 0.096, P = 0.392). Less than pNN47 was shown to have a correlation with other variables.

Conclusions

These data suggest that pNN50 can not reflect the level of vagal tone during GA.

Fig. 1.

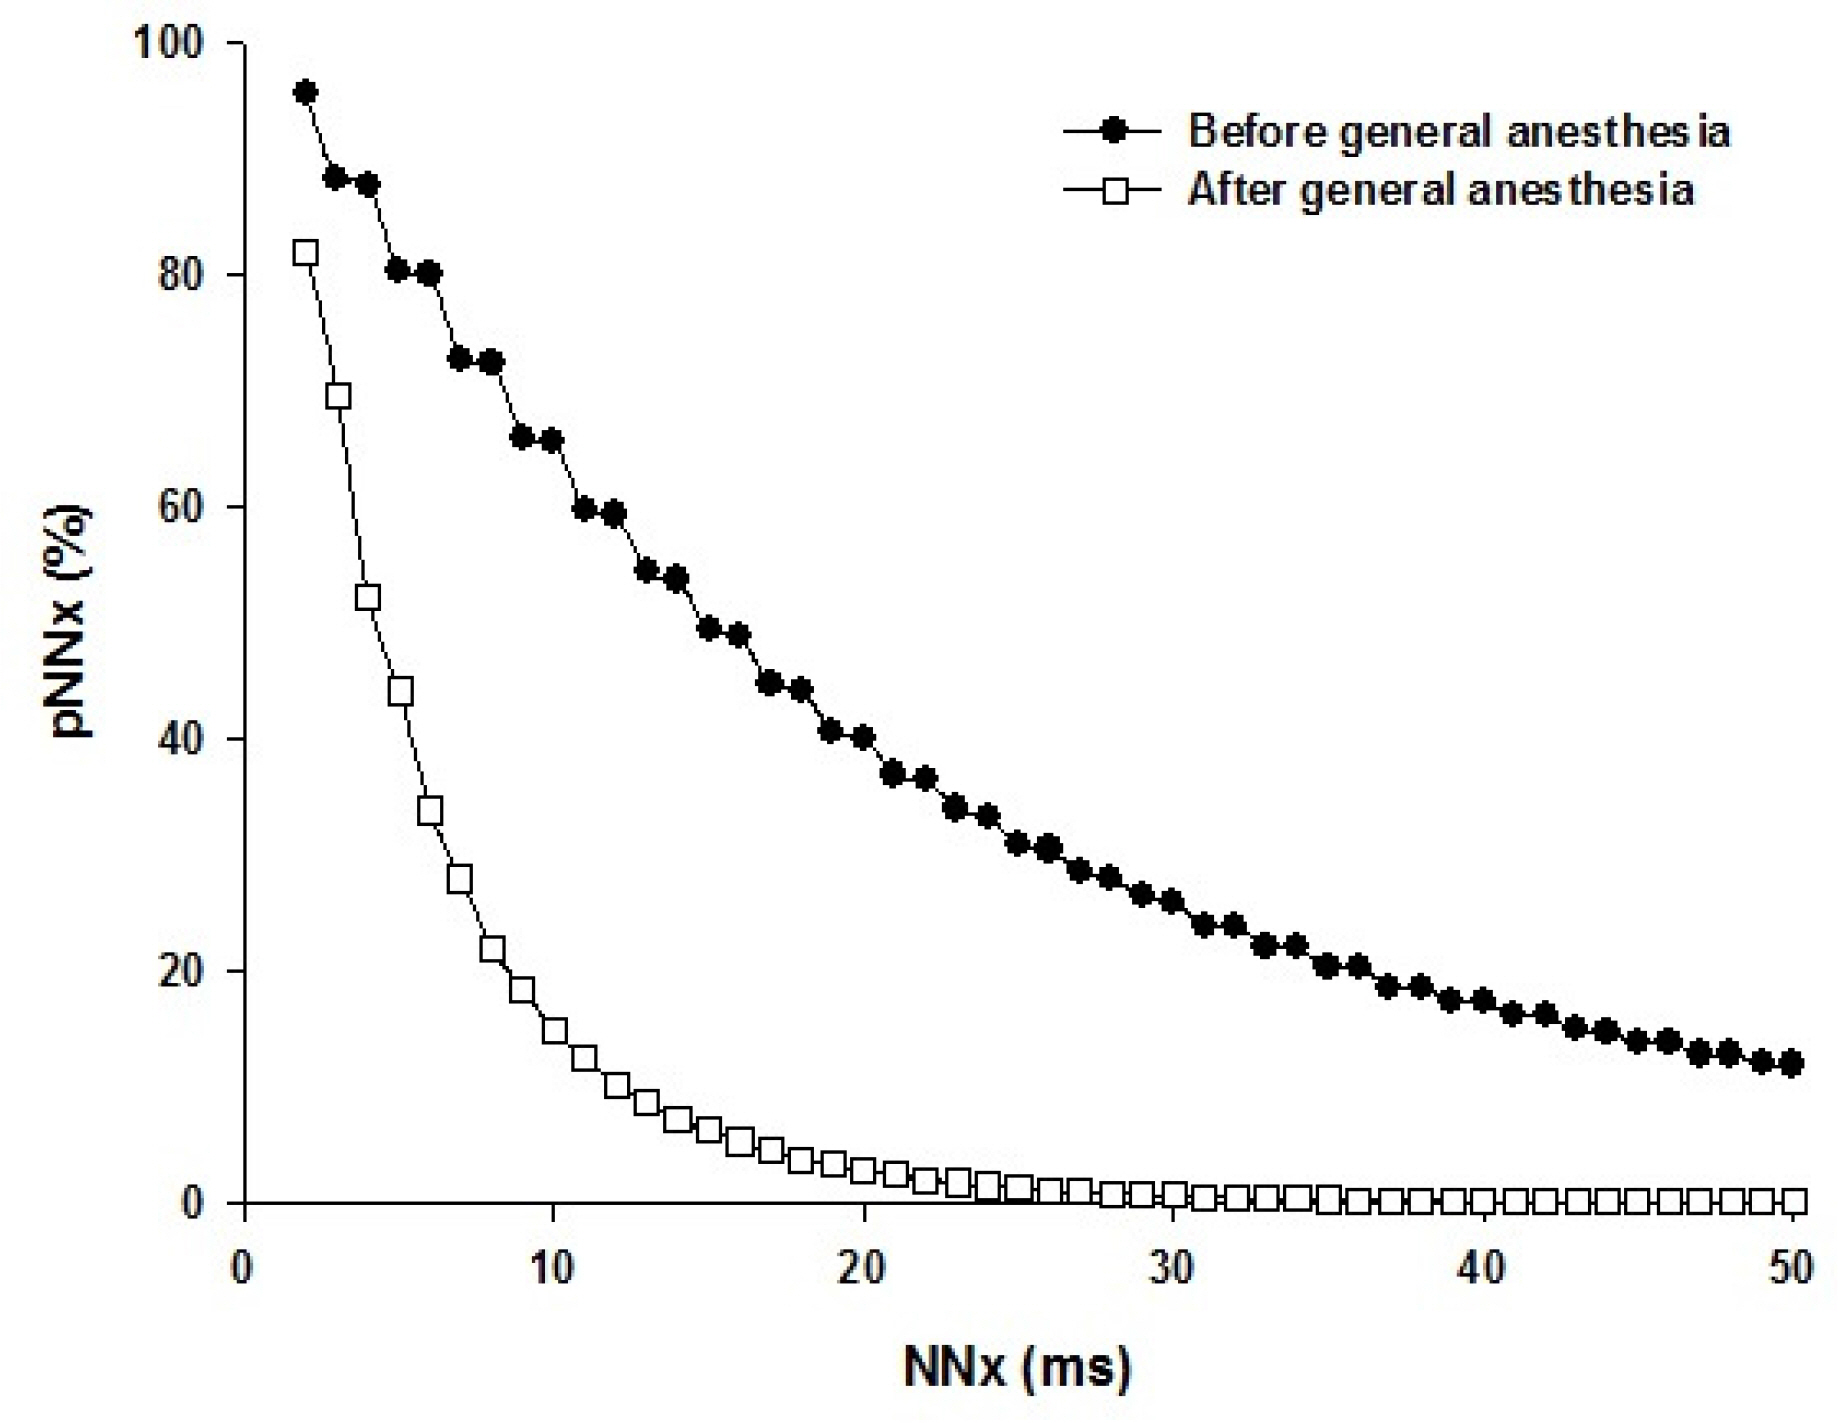
Mean pNNx distributions. During general anesthesia, pNNx is significantly lower than before general anesthesia state and nearly zero at greater than 30 ms. pNNx; proportion of successive RR intervals differences > 2 - 50 ms in relation to total RR intervals (x = 2 - 50 ms).

Fig. 2.

Correlations between RMSSD, pNN50, SD1 and LnHF. The effect of general anesthesia. Ln RMSSD and Ln SD1 are significantly correlated with Ln HF at before and after general anesthesia state. Note that pNN50 is not correlated with Ln HF during general anesthesia. Ln HF (ms2): natural logarithmic transformed of high frequency power of heart rate variability, Ln RMSSD (ms): natural logarithmic transformed of root mean square of successive differences of RR intervals, pNN50 (%): proportion of successive RR intervals differences > 50 ms in relation to the total RR intervals, Ln SD1 (ms): natural logarithmic transformed of standard deviation 1 from the Poincaré analysis.

Fig. 3.

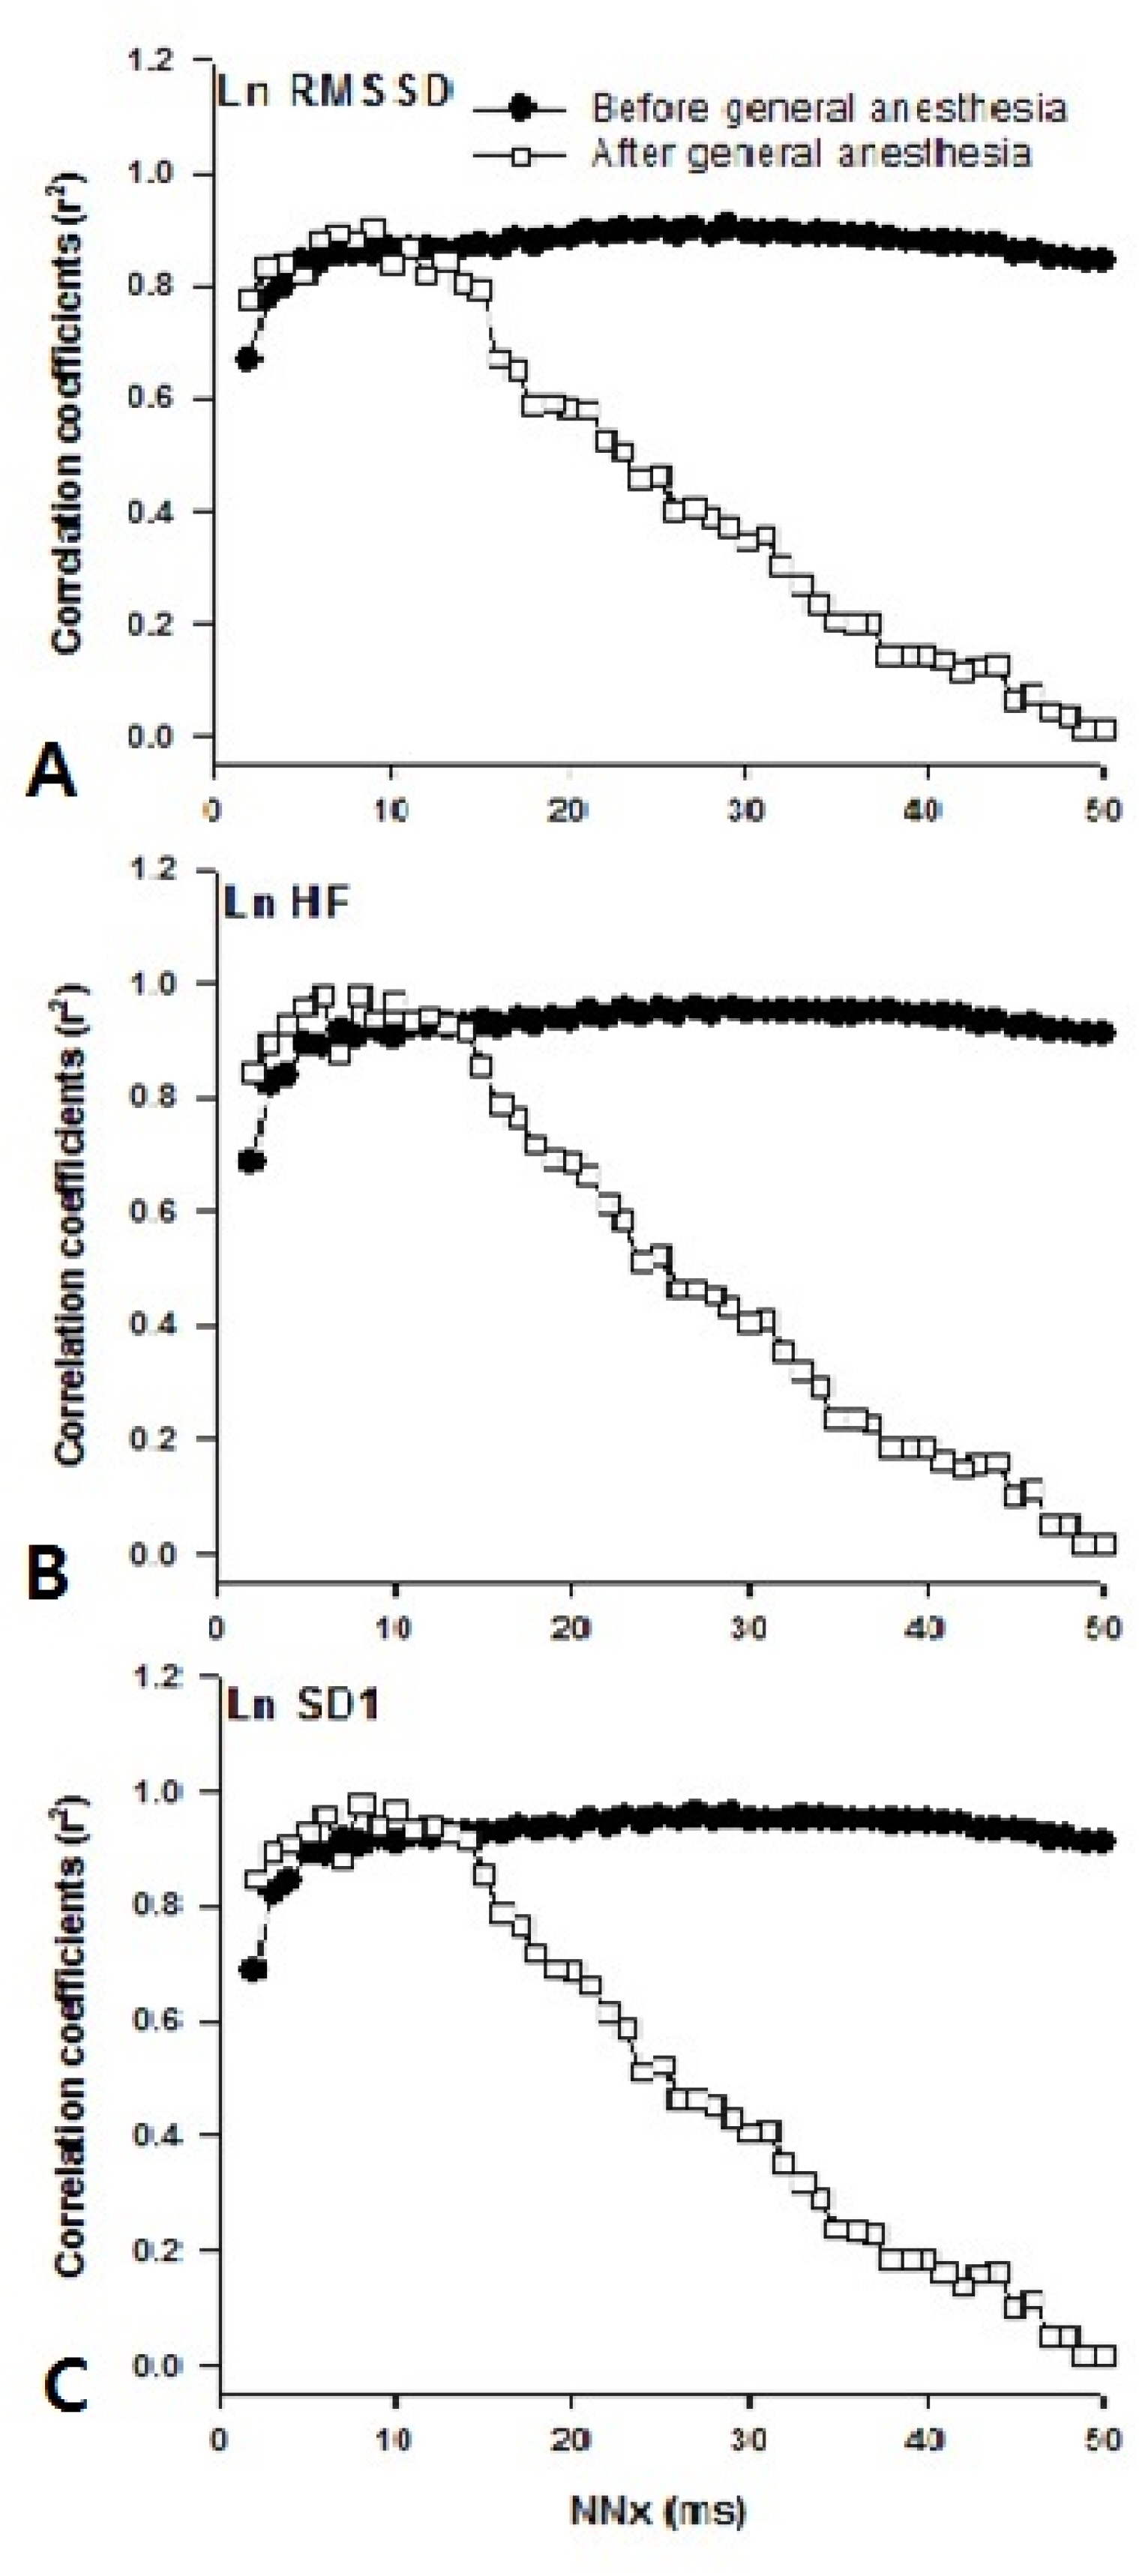
Correlations of Ln RMSSD (A), LnHF (B), and Ln SD1 (C) for pNNx. pNN values greater than 47 ms are not correlated with other three parameters. Ln RMSSD (ms): natural logarithmic transformed of root mean square of successive differences of RR intervals, LnHF (ms2): natural logarithmic transformed high frequency power of heart rate variability, Ln SD1 (ms); natural logarithmic transformed of standard deviation 1 from the Poincaré analysis, NNx (ms): successive RR intervals differences > x ms (x = 2 - 50 ms).

Demographic Data

Descriptive Statistics of Indices Derived from Heart Rate Variability

References

1. Heart rate variability: standards of measurement, physiological interpretation and clinical use. Task Force of the European Society of Cardiology and the North American Society of Pacing and Electrophysiology. Circulation 1996;93:1043–65.
2. Akselrod S, Gordon D, Ubel FA, Shannon DC, Berger AC, Cohen RJ. Power spectrum analysis of heart rate fluctuation: a quantitative probe of beat-to-beat cardiovascular control. Science 1981;213:220–2.
3. Fleisher LA. Heart rate variability as an assessment of cardiovascular status. J Cardiothorac Vasc Anesth 1996;10:659–71.
4. Vongpatanasin W, Taylor JA, Victor RG. Effects of cocaine on heart rate variability in healthy subjects. Am J Cardiol 2004;93:385–8.
5. Ewing DJ, Neilson JM, Travis P. New method for assessing cardiac parasympathetic activity using 24 hour electrocardiograms. Br Heart J 1984;52:396–402.
6. Voss A, Kurths J, Kleiner HJ, Witt A, Wessel N, Saparin P, et al. The application of methods of non-linear dynamics for the improved and predictive recognition of patients threatened by sudden cardiac death. Cardiovasc Res 1996;31:419–33.
7. Silipo R, Deco G, Vergassola R, Gremigni C. A characterization of HRV's nonlinear hidden dynamics by means of Markov models. IEEE Trans Biomed Eng 1999;46:978–86.
8. Busjahn A, Voss A, Knoblauch H, Knoblauch M, Jeschke E, Wessel N, et al. Angiotensin-converting enzyme and angiotensinogen gene polymorphisms and heart rate variability in twins. Am J Cardiol 1998;81:755–60.
9. Mietus JE, Peng CK, Henry I, Goldsmith RL, Goldberger AL. The pNNx files: reexamining a widely used heart rate variability measure. Heart 2002;88:378–80.
10. Donchin Y, Feld JM, Porges SW. Respiratory sinus arrhythmia during recovery from isoflurane-nitrous oxide anesthesia. Anesth Analg 1985;64:811–5.
11. Bäcklund M, Toivonen L, Tuominen M, Pere P, Lindgren L. Changes in heart rate variability in elderly patients undergoing major noncardiac surgery under spinal or general anesthesia. Reg Anesth Pain Med 1999;24:386–92.
12. Kato M, Komatsu T, Kimura T, Sugiyama F, Nakashima K, Shimada Y. Spectral analysis of heart rate variability during isoflurane anesthesia. Anesthesiology 1992;77:669–74.
13. Latson TW, McCarroll SM, Mirhej MA, Hyndman VA, Whitten CW, Lipton JM. Effects of three anesthetic induction techniques on heart rate variability. J Clin Anesth 1992;4:265–76.
14. Nolan J, Batin PD, Andrews R, Lindsay SJ, Brooksby P, Mullen M, et al. Prospective study of heart rate variability and mortality in chronic heart failure: results of the United Kingdom heart failure evaluation and assessment of risk trial (UK-heart). Circulation 1998;98:1510–6.
15. La Rovere MT, Pinna GD, Hohnloser SH, Marcus FI, Mortara A, Nohara R, et al. Baroreflex sensitivity and heart rate variability in the identification of patients at risk for life-threatening arrhythmias: implications for clinical trials. Circulation 2001;103:2072–7.
16. Huh IY, Kim YK, Hwang GS. Change of heart rate variability before and after general anesthesia. Korean J Anesthesiol 2005;49:447–54.
17. Kleiger RE, Bigger JT, Bosner MS, Chung MK, Cook JR, Rolnitzky LM, et al. Stability over time of variables measuring heart rate variability in normal subjects. Am J Cardiol 1991;68:626–30.
18. Anan T, Sunagawa K, Araki H, Nakamura M. Arrhythmia analysis by successive RR plotting. J Electrocardiol 1990;23:243–8.
19. Tulppo MP, Mäkikallio TH, Takala TE, Seppänen T, Huikuri HV. Quantitative beat-to-beat analysis of heart rate dynamics during exercise. Am J Physiol 1996;271:H244–52.
20. Berger RD, Saul JP, Cohen RJ. Transfer function analysis of autonomic regulation. I. Canine atrial rate response. Am J Physiol 1989;256:H142–52.
21. Bigger JT Jr, Fleiss JL, Steinman RC, Rolnitzky LM, Kleiger RE, Rottman JN. Correlations among time and frequency domain measures of heart period variability two weeks after acute myocardial infarction. Am J Cardiol 1992;69:891–8.
22. Cohen MA, Taylor JA. Short-term cardiovascular oscillations in man: measuring and modelling the physiologies. J Physiol 2002;542:669–83.
23. Waxman MB, Wald RW. Termination of ventricular tachycardia by an increase in cardiac vagal drive. Circulation 1977;56:385–91.
24. Baumert JH, Frey AW, Adt M. [Analysis of heart rate variability. Background, method, and possible use in anesthesia]. Anaesthesist 1995;44:677–86.
25. Latson TW, O'Flaherty D. Effects of surgical stimulation on autonomic reflex function: assessment by changes in heart rate variability. Br J Anaesth 1993;70:301–5.
26. Galletly DC, Westenberg AM, Robinson BJ, Corfiatis T. Effect of halothane, isoflurane and fentanyl on spectral components of heart rate variability. Br J Anaesth 1994;72:177–80.
27. Gravlee GP, Ramsey FM, Roy RC, Angert KC, Rogers AT, Pauca AL. Rapid administration of a narcotic and neuromuscular blocker: a hemodynamic comparison of fentanyl, sufentanil, pancuronium, and vecuronium. Anesth Analg 1988;67:39–47.
28. Komatsu T, Singh PK, Kimura T, Nishiwaki K, Bando K, Shimada Y. Differential effects of ketamine and midazolam on heart rate variability. Can J Anaesth 1995;42:1003–9.
29. Hutchinson TP. Statistics and graphs for heart rate variability: pNN50 or pNN20? Physiol Meas 2003;24:N9–14.
30. Perkiömäki JS, Zareba W, Kalaria VG, Couderc J, Huikuri HV, Moss AJ. Comparability of nonlinear measures of heart rate variability between long- and short-term electrocardiographic recordings. Am J Cardiol 2001;87:905–8.
31. Heart rate variability. Standards of measurement, physiological interpretation, and clinical use. Task Force of the European Society of Cardiology and the North American Society of Pacing and Electrophysiology. ÉúŕH́éárt́́J ́ 1996;17:354–381.
32. Nolan J, Batin PD, Andrews R, Lindsay SJ, Brooksby P, Mullen M, et al. Prospective study of heart rate variability and mortality in chronic heart failure: results of the United King- dom heart failure evaluation and assessment of risk trial (UK-heart). Circulation 1998;98:1510–1516.
33. Rajendra Acharya U, Paul Joseph K, Kannathal N, Lim CM, Suri JS. Heart rate variability: a review. Med Biol Eng Comput 2006;44:1031–51.
Article information Continued

Fig. 1.

Mean pNNx distributions. During general anesthesia, pNNx is significantly lower than before general anesthesia state and nearly zero at greater than 30 ms. pNNx; proportion of successive RR intervals differences > 2 - 50 ms in relation to total RR intervals (x = 2 - 50 ms).

Fig. 2.

Correlations between RMSSD, pNN50, SD1 and LnHF. The effect of general anesthesia. Ln RMSSD and Ln SD1 are significantly correlated with Ln HF at before and after general anesthesia state. Note that pNN50 is not correlated with Ln HF during general anesthesia. Ln HF (ms2): natural logarithmic transformed of high frequency power of heart rate variability, Ln RMSSD (ms): natural logarithmic transformed of root mean square of successive differences of RR intervals, pNN50 (%): proportion of successive RR intervals differences > 50 ms in relation to the total RR intervals, Ln SD1 (ms): natural logarithmic transformed of standard deviation 1 from the Poincaré analysis.

Fig. 3.

Correlations of Ln RMSSD (A), LnHF (B), and Ln SD1 (C) for pNNx. pNN values greater than 47 ms are not correlated with other three parameters. Ln RMSSD (ms): natural logarithmic transformed of root mean square of successive differences of RR intervals, LnHF (ms2): natural logarithmic transformed high frequency power of heart rate variability, Ln SD1 (ms); natural logarithmic transformed of standard deviation 1 from the Poincaré analysis, NNx (ms): successive RR intervals differences > x ms (x = 2 - 50 ms).

Table 1.

Demographic Data

ASA score (1/2) 80 (48/32)
Age (yr) 45.7 ± 11.9
Sex (M/F) 80 (50/30)
Body weight (kg) 74.2 ± 30.5
Height (cm) 158.9 ± 28.9
Values are mean ± SD or n number of patients.

Table 2.

Descriptive Statistics of Indices Derived from Heart Rate Variability

Variables Before GA After GA
Time-domain
RRI, ms 846.1 ± 135.8 818.8 ± 155.4
pNN50, % 11.42 ± 16.49 0.00 ± 0.03
Ln RMSSD, ms 3.18 ± 0.63 1.65 ± 0.54
Frequency-domain
Ln LF, ms2 9.13 ± 0.89 5.01 ± 1.22
Ln LF, ms2 8.14 ± 1.26 4.82 ± 1.24
nuLF, (nu) 0.71 ± 0.15 0.54 ± 0.21*
nuLF, (nu) 0.29 ± 0.15 0.46 ± 0.21*
LF/HF ratio 3.32 ± 2.18 1.97 ± 2.22
Nonlinear method (Poincaré plot)
Ln SD1(ms) 2.82 ± 0.62 1.31 ± 0.56

Values are mean ± SD. GA: general anesthesia, RRI: RR intervals, pNN50: proportion of successive RRI differences > 50 ms in relation to the total RRI, Ln RMSSD: natural logarithmic-transformed of root mean square of successive differences of RRI, Ln LF: natural logarithmic-transformed of low frequency, Ln HF: natural logarithmic-transformed of high frequency, nuLF: normalized unit of low frequency, nuHF: normalized unit of high frequency, LF/HF ratio: ratio between low frequency and high frequency, Ln SD1: natural logarithmic-transformed of standard deviation 1 from the Poincaré plots analysis. * P < 0.05, † P < 0.001 versus before state.