 KOSIN UNIVERSITY COLLEGE OF MEDICINE
Articles
- Page Path
- HOME > Kosin Med J > Volume 34(2); 2019 > Article
-
Original Article
Genipin Inhibits Hypoxia-Induced Accumulation of HIF-1α and VEGF Expressions in Human Cervical Carcinoma Cells - Cho Eui Jin, Jung Hyun Lee, Geun Joo Kim, Tae Hwa Lee
-
Kosin Medical Journal 2019;34(2):106-116.
DOI: https://doi.org/10.7180/kmj.2019.34.2.106
Published online: December 31, 2019
1Department of Obstetrics and Gynecology, College of Medicine, Kosin University, Busan, Korea.
2Department of Pediatrics, College of Medicine, Kosin University, Busan, Korea.
- Corresponding Author: Tae-Hwa Lee, Department of Obstetrics and Gynecology, College of Medicine, Kosin University, 262, Gamcheon-ro, seo-gu, Busan 49267, Korea. Tel: +82-51-990-6722 Fax: +82-51-244-6939, leehula@hanmail.net
• Received: July 22, 2019 • Revised: November 1, 2019 • Accepted: November 13, 2019
Copyright © 2019 Kosin University College of Medicine
Articles published in Kosin Medical Journal are open-access, distributed under the terms of the Creative Commons Attribution Non-Commercial License (http://creativecommons.org/licenses/by-nc/4.0/) which permits unrestricted non-commercial use, distribution, and reproduction in any medium, provided the original work is properly cited.
- 1,173 Views
- 7 Download
- 3 Crossref
Abstract
-
Objectives
- Hypoxia—a characteristic of almost all types of solid tumors—has been associated with poor outcomes in several human malignancies. Genipin—an active constituent of Gardenia fruit— has been reported to exert an anti-tumor effect in several cancers. In this study, we investigated inhibition of angiogenesis using Genipin-mediated hypoxia-induced hypoxia inducible factor (HIF-1) and VEGF expression in human cervical cancer cells.
-
Methods
- Under normoxic and hypoxic conditions, the expression of HIF-1α and VEGF in cervical cancer HeLa cells was detected by quantitative reverse transcription polymerase chain reaction and western blotting. Luciferase reporter assays were used to investigate the molecular mechanisms underlying the hypoxia-induced survivin activation.
-
Results
- Surprisingly, we found that Genipin suppressed the HIF-1α accumulation during hypoxia in human liver cancer cell line (HepG2), human prostate cancer cell line (LNCaP), colon cancer cell line (HCT116), and breast cancer cell line (MDA231). Genipin treatment also significantly reduced hypoxia-induced secretion of VEGF.
-
Conclusions
- Suppression of HIF-1α accumulation following treatment with Genipin under hypoxia was associated with PI3K and MAPK pathways. Taken together, these results suggested that Genipin inhibits HIF-1α expression through inhibition of PI3K and MAPK signaling pathways. These results provide new insights into a potential mechanism of the anticancer properties of Genipin.
- Reagents
- Genipin (purity ≥ 99.68%) was purchased from Sigma-Aldrich. Monoclonal antibody against HIF-1α and growth-factor-reduced Matrigel were purchased from BD Biosciences (Bedford, MA, USA). The horseradish peroxidase (HRP)-conjugated anti-rabbit IgG and anti-mouse IgG were purchased from Perkin-Elmer Life Sciences (Boston, MA, USA). Antibodies against phospho-AKT (Ser473), AKT, phospho-ERK1/2 (Thr202/Tyr204), ERK1/2, MMP2, and MMP9, were purchased from Cell Signaling Technology (Beverly, MA, USA). The selective proteasome inhibitor, MG132, and protein synthesis inhibitor, cycloheximide (CHX) were purchased from Sigma Chemical (St Louis, MO, USA). PI3K/AKT inhibitor, LY294002, and Erk1/2 inhibitor, U0126, were purchased from Cell Signaling Technology (Beverly, MA, USA).
- Cell culture
- Human cervical cancer HeLa, prostate cancer LNCaP, colon cancer HCT116, liver cancer HepG2, and breast cancer MDA231 cell lines were obtained from the American Type Culture Collection (Manassas, VA, USA). Human umbilical vein endothelial cells (HUVECs) were obtained from Invitrogen. HeLa, LNCaP, HepG2, and MDA231 cells were maintained in Dulbecco's modified Eagle's medium (DMEM) and HCT116 cells were cultured in McCoy's 5A medium (Invitrogen, Carlsbad, CA, USA), respectively, and grown at 37 ℃ in a humidified atmosphere under 5% CO2; all media were supplemented with 10% heat-inactivated fetal bovine serum (FBS), 100 U/mL penicillin, and 100 U/mL streptomycin. Reagents for cell culture were obtained from Gibco BRL Life Technologies (Grand Island, NY, USA). Trypsin (0.25%) solution was used to detach the cells from the culture dishes for sub-culturing.
- Hypoxia and drug treatments
- Before the experiments, cells were grown to approximately 80% confluence in 60 or 100 mm tissue culture dishes. For hypoxia treatment, petri dishes containing cells were incubated in a hypoxic chamber (Forma Scientific, Marietta, OH) with a 94:5:1 mixture of N2/CO2/O2.
- Deoxygenated mediums were prepared prior to each experiment by equilibrating the medium with a hypoxic gas mixture containing 5% CO2, 94% N2, and 1% O2 at 37 ℃. Exponentially growing cells (at 70–80% confluence) in complete medium were co-treated with different concentrations of Genipin, followed by continual incubation under either normoxia or hypoxia (1% O2) for indicated time intervals depending on the purpose of the experiment.
- Enzyme-linked immunosorbent assay for detection of VEGF
- Cells were plated in a 60 mm plate at a density of 1 × 10⁵ cells/mL in DMEM medium and incubated overnight before the cells were subjected to relevant treatments. Levels of VEGF protein in the medium were determined by ELISA using a commercial kit (R&D Systems, Minneapolis, MN, USA), according to the manufacturer's instructions and our previous reports.
- Degradation and synthesis assays of HIF-1α
- In order to investigate the effects of Genipin on the degradation and synthesis of serum-induced HIF-1α protein, HeLa cells were serum-starved for 24 h. Subsequently, the cells were cultured in complete medium containing 10% FBS for 12 h in the presence or absence of Genipin (100 µM), and then, the cells were treated with 28 µg/mL CHX for different time periods to further inhibit the protein synthesis. In parallel, serum-starved cells were pretreated with 20 µM MG132 for 30 min, and then, the cells were cultured in complete medium containing 10% FBS for 12 h in the presence or absence of Genipin (100 µM). Expression of HIF-1α at the protein level was determined by western blotting.
- Protein extraction and western blotting
- Cells were seeded into 60-mm culture dishes and allowed to attach for 24 h. Following the treatment, cells were washed with ice-cold phosphate buffered saline (PBS) [140 mM NaCl, 3 mM KCl, 6 mM Na2HPO4, and 1 mM KH2PO4 (pH 7.4)] and harvested by centrifugation at 2000 ×g for 10 min at 4 ℃. Whole-cell extracts were lysed with lysis buffer (50 mM Tris-HCl (pH 7.5), 5 mM EDTA, 150 mM NaCl, 0.5% Triton X-100, 10 mM sodium fluoride, 20 mM β-mercaptoethanol, 250 µM sodium orthovanadate, and 1 mM PMSF) containing complete protease inhibitor cocktail (Sigma, USA) and incubated at 4 ℃ for 30 min. Cell lysates were then centrifuged at 12000 ×g for 10 min. The supernatants were collected and stored at −80 ℃. A total of 80 µg protein quantified by BCA Protein Assay Kit (Bio-Rad Labs, Hercules, CA, USA) was resolved by sodium dodecyl sulphate-polyacrylamide gel electrophoresis (SDS-PAGE) using 6–12% gel and transferred to polyvinylidene fluoride (PVDF) membrane. Membrane was blocked with Tris-buffered saline (TBS) containing 5% (w/v) non-fat dry milk and 0.1% (v/v) Tween-20 for 1 h at room temperature. The membrane was then probed with primary antibodies against HIF-1α, VEGF, total or phosphorylated Akt (Ser473), total or phosphorylated ERK1/2 (Thr202/Tyr204), and so on at 4 ℃ overnight. After washing, the membrane was incubated with HRP-conjugated secondary antibody (1:2000; Pierce) at room temperature for 1 h. Immunodetection was performed with an enhanced chemiluminescence (ECL) detection kit (Cell Signaling Technology, Beverly, MA, USA). To ensure the equal loading of protein, the blots were reprobed with a specific antibody against human β-actin (1:5000). For the immunoblotting experiments, the assays were performed repeatedly at least three times. Densitometric analysis was performed with a computer using a gel image analysis program.
- Reverse transcription PCR (RT-PCR)
- Total RNA was extracted from cancer cells using Trizol reagent (Invitrogen, USA) and subjected to DNase I (Fermentas, Canada) treatment to eliminate the genomic DNA contamination. RT-PCR analysis was performed to quantify the expressions of HIF-1α and VEGF at the mRNA level using Two-Step RT-PCR kit (Qiagen, Valencia, CA, USA) with primers specific to HIF-1α (forward primer:5′-ACTCAGGACACAGAT TTAGACTTG-3′; reverse primer: 5′-ATCAGTGGTGGCAGTGGTAG-3′) and VEGF (forward primer: 5′-TTGCCTTGCTGCTCTACC-3′; reverse primer: 5′-CACAGGATGGCTTGAA GATG-3′). Glyceraldehyde 3-phosphate dehydrogenase (GAPDH) (forward primer: 5′-AGGTCGGAGTCAACGGATTTG-3′; reverse primer: 5′-AGGGGCCATCCACAGTCTTC-3′) was selected as the housekeeping gene. All the primers were synthesized by Generay Biotech Co., Ltd (Shanghai, China). Briefly, following a pre-step at 50 ℃ for 5 min and 95 ℃ for 5 min, PCR amplification was conducted with 35 cycles at a melting temperature of 95 ℃ for 30 s, and an annealing temperature of 59 ℃ (HIF-1α) or 67 ℃ (VEGF) for 45 s. Finally, an extension step at 72 ℃ was performed.
- Cell proliferation assays
- The proliferation effect of Genipin was determined by MTS assay. Briefly, HeLa cells or HUVECs were plated in a 96-well plate at a density of 1 × 10⁶ cells/well. Cells were serum-starved for 24 h, and then, treated with Genipin at various concentrations (25–100 µM) in complete medium containing 10% FBS. After one 12-h incubation, 20 µL of MTS reagent (5 mg/mL in PBS) was added to each well, and the plates were incubated at 37 ℃ for 4 h. After the incubation, the medium was replaced with 150 µL DMSO, and the plates were shaken on a shaking table for 10 min. Absorbance was measured at 570 nm using an automated microplate reader (EL808, Bio-Tek, Winooski, VT, USA).
- Capillary-like tube formation assay
- Briefly, 96-well culture plates were coated with 50 µL of ice-cold Matrigel (BD Biosciences, Grenoble, France), which was then allowed to solidify at 37 ℃ for 1 h. Human umbilical vein endothelial cells were suspended in endothelial cell growth media containing hVEGF, and seeded onto the Matrigel layer at a density of 1.5 × 10⁴ cells/well. Cells were treated with various concentrations of Genipin and then incubated at 37 ℃ under 5% CO2 humidified atmosphere for 12 h. Tubular structures of endothelial cells were photographed with an inverted microscope (Olympus; magnification, 100x).
- HUVEC tube formation assay
- Matrigel (200 µL) (10 mg/mL) (BD Biosciences, NJ) was polymerized for 30 min at 37 ℃. The HUVECs were suspended in M199 (5% FBS) medium at a density of 2.5 × 10⁵ cells/mL. Then, 0.2 mL of cell suspension was added to each Matrigel-coated well either with or without varying concentrations of Genipin, and then, they were incubated for 14 h. The morphological changes in the cells and HUVEC tube formations were observed under a phase-contrast microscope and photographed at 200x magnification.
- Statistical analysis
- Statistical significance was examined using Student's t test. The two-sample t test was used for two-group comparisons. Values were reported as mean ± SD. P < 0.05 were considered statistically significant and indicated by asterisks in the figures. Bands obtained during western blotting were examined by average densitometric analysis using ImageJ software (NIH).
MATERIALS AND METHODS
- Genipin inhibits the accumulation of HIF-1α under hypoxic conditions
- In the present study, we investigated whether Genipin inhibits hypoxia-induced accumulation of HIF-1α in HeLa cells. We first examined whether Genipin induces cytotoxicity under hypoxic conditions and whether Genipin-induced cytotoxicity is responsible for the suppression of HIF-1α accumulation. The effects of Genipin on cell viability and drug-induced PARP-1 cleavage, the hallmark feature of apoptosis (data not shown), were determined by trypan blue exclusion dye assay and western blotting, respectively (Fig. 1A). When HeLa cells were treated with various concentrations of Genipin (1–50 µM) for 8 h in hypoxic conditions, no significant concentration-dependent reduction of the cell viability was observed (Fig. 1A). We found that HIF-1α accumulation occurred in a time-dependent manner during hypoxia (Fig. 1B). Surprisingly, we observed that reduction of HIF-1α accumulation occurred during treatment with Genipin (for 8 h) under hypoxic condition (Fig. 1C). The extent of reduction in HIF-1α accumulation was dependent upon Genipin concentration during hypoxia. We also studied the effect of two other known HIF-1 inducers, COCl2 and DFX, during Genipin treatment on HeLa cells. As shown in the Figure 1D, HIF-1α protein levels were markedly decreased after treatment with Genipin in the presence of both COCl2 and DFX. To examine whether our observations could be generalized, we investigated four different cell lines, HepG2, LNCaP, HCT116, and MDA231. Figure 2 shows that HIF-1α accumulation was suppressed by treatment with Genipin under hypoxic conditions in all four cell lines.
- Inhibition of HIF-1 accumulation by Genipin during hypoxia is AKT and ERK signaling pathway-dependent
- Recent studies have indicated that expression of HIF-1α can be regulated by PI3K/AKT and two kinases of the MAPK signaling pathway, as ERK1/2 has been implicated in the regulation of HIF-1α expression.9 To examine whether the inhibition of HIF-1α accumulation following treatment with Genipin during hypoxia occurs via inhibition of the PI3K and MAPK signaling pathways, the cells were treated with PI3K inhibitor, LY294002, or MAP Kinase inhibitor, PD98059, prior to the following: hypoxia alone, Genipin treatment alone, or combined hypoxia and Genipin treatment. Figures 3A and 3B show that LY294002 and PD98059 treatment led to dephosphorylation (inactivation) of Akt and ERK regardless of oxygen levels. Interestingly, LY294002 and PD98059 inhibited accumulation of HIF-1α during hypoxia (Fig. 3A, 3B). Next, to investigate whether Genipin inhibits expression of HIF-1α via these signaling pathways, we determined the effects of Genipin on the activation of AKT and ERK by immunoblotting. We found that Genipin inhibited Akt and ERK phosphorylation in HeLa cells (Fig. 1C, 3C). These results suggested that Genipin-induced inhibition of HIF-1α accumulation during hypoxia is mediated via dephosphorylation of Akt and ERK.
- Genipin inhibited hypoxia-induced VEGF expression and cell invasion
- VEGF is an immediate downstream target gene of HIF-1a and plays a critical role in tumor angiogenesis. To determine whether Genipin could inhibit hypoxia-induced VEGF expression, we examined VEGF expression by western blotting. Our results showed that treatment of HeLa cells with Genipin led to a dose-dependent decrease in hypoxia-induced VEGF expression at protein levels (Data not shown). We also examined whether reduction of HIF-1α accumulation after treatment with Genipin under hypoxic conditions led to decrease in the extracellular level of VEGF. Figure 4A shows an increase in VEGF level in a time-dependent manner (up to 24 h) during hypoxia in HeLa cells. However, VEGF expression was decreased after treatment with Genipin under hypoxic conditions (Fig. 4B). We next examined whether hypoxic conditions enhanced the invasiveness of HeLa cells and whether Genipin can suppress tumor migration. Recent studies have shown that hypoxia exhibits stimulatory effects on cancer cell invasion and migration.12 To investigate whether Genipin suppresses hypoxia-induced cancer cell invasion, an in vitro cell invasion assay was performed. As shown in (Fig. 4C), under normoxic conditions, an increase in the baseline invasiveness of HeLa cells was observed under conditions of hypoxia as compared to normoxic conditions (Fig. 4C). On the other hand, pretreatment with 5 µM Genipin suppressed the hypoxia-stimulated invasiveness of HeLa cells (Fig. 4C). In addition, we also confirmed that Genipin inhibits invasion-related proteins, MMP-2, MMP-9, uPA, and p-ERK, under hypoxic conditions (Fig. 4D). These results indicated that Genipin suppresses hypoxia-stimulated invasiveness of HeLa cells.
RESULTS
- In this study, we investigated whether Genipin inhibits hypoxia-induced HIF-1α accumulation in a dose-dependent manner in several human cancer cell lines. Inhibition of HIF-1α accumulation by Genipin is mediated via inhibition of protein synthesis under hypoxic conditions.
- Angiogenesis, a characteristic hallmark of cancer, sustains a tumor's invasive nature. As brain cancers are known to express low levels of oxygen, debilitating the growth of new blood vessels through the use of dietary chemotherapeutic agents may provide an effective strategy to delay the cancer's progression. In this study, it was observed that Genipin diminishes the extent of hypoxia through decreased accumulation of HIF-1α as a result of the suppression of phosphorylation of ERK and Akt. The decreased expression of VEGF led to a marked reduction in the levels of MMP-2, MMP-9, and uPA, which are proteins associated with vascularization.
- Our previous studies indicated that inactivation of the PI3K/Akt and ERK 1/2 signaling pathways reduces hypoxia-driven growth of tumor cells. Since phosphorylation of Akt and ERK was significantly attenuated, Genipin modulates the hypoxic response through regulations of these signaling pathways. Since the phosphorylation events are downstream of the EGFR activation, it is probable that Genipin exerts its inhibitory effect on EGFR. Recent studies on the role isothiocyanates play in the control of prostate cancer as well as ovarian cancer attribute the antiproliferative effects of Genipin to the inhibition of EGFR. The significance of EGFR targeting in controlling glioblastoma is evidenced by the finding that EGFR is overexpressed in approximately 50–60% of glioblastoma tumors.
- Since inhibition of the ERK1/2 signaling pathway was found to be associated with a decrease in VEGF production, the use of phosphorylated ERK as a marker of cell invasiveness was verified. The VEGF levels, which are upregulated during hypoxic conditions, decreased along with the diminishing levels of MMP-2, MMP-9, and uPA in the presence of Genipin (Fig. 4). The overexpression of MMPs, endopeptidases necessary for basement membrane degradation, has been observed in several types of cancers and is associated with tumor angiogenesis, metastasis, and growth factor release from the extracellular matrix (ECM). The proteolytic cleavage and destruction of the ECM to which tumor cells adhere, allows for cancer cell metastasis. In concordance with the previous literature, it was found that Genipin inhibits MMP-2, MMP-9, and uPA expressions. The aberrations in protein levels were manifested as a decrease in the percentage of invasive cells under hypoxic conditions.
- The anti-angiogenic response elicited by Genipin might, in part, be related to the disruption of reactive-oxygen species (ROS) metabolism. Previous studies have reported that elevated levels of ROS may activate HIF-1α. VEGF expression through EGF-induced activation of the PI3K/Akt and ERK pathways has been shown to be modulated by ROS.10
- In this study, Genipin was able to further reduce the levels of the phosphorylated proteins in combination with LY294002, an Akt inhibitor, or with PD98059, an ERK inhibitor. Therefore, the use of Genipin along with the currently used chemotherapeutic drugs may clinically strengthen the anti-cancer physiological response. Elucidation of the molecular basis by which Genipin is able to inhibit angiogenesis via the suppression of phosphorylated Akt and ERK, HIF-1α, and ultimately, VEGF may be useful for the development of a novel therapy for brain cancer.
DISCUSSION
- 1. Folkman J. Role of angiogenesis in tumor growth and metastasis. Semin Oncol 2002;29:15–18.Article
- 2. Ferrara N, Bunting S. Vascular endothelial growth factor, a specific regulator of angiogenesis. Curr Opin Nephrol Hypertens 1996;5:35–44.ArticlePubMed
- 3. Krishnamachary B, Berg-Dixon S, Kelly B, Agani F, Feldser D, Ferreira G, et al. Regulation of colon carcinoma cell invasion by hypoxia-inducible factor 1. Cancer Res 2003;63:1138–1143.PubMed
- 4. Fang J, Zhou Q, Liu LZ, Xia C, Hu X, Shi X, et al. Apigenin inhibits tumor angiogenesis through decreasing HIF-1alpha and VEGF expression. Carcinogenesis 2007;28:858–864.ArticlePubMed
- 5. Garcia-Maceira P, Mateo J. Silibinin inhibits hypoxia-inducible factor-1alpha and mTOR/p 70S6K/4E-BP1 signalling pathway in human cervical and hepatoma cancer cells: implications for anticancer therapy. Oncogene 2009;28:313–324.ArticlePubMed
- 6. Tang X, Zhang Q, Shi S, Yen Y, Li X, Zhang Y, et al. Bisphosphonates suppress insulin-like growth factor 1-induced angiogenesis via the HIF-1alpha/VEGF signaling pathways in human breast cancer cells. Int J Cancer 2010;126:90–103.ArticlePubMedPMC
- 7. Kallio PJ, Wilson WJ, O'Brien S, Makino Y, Poellinger L. Regulation of the hypoxia inducible transcription factor 1alpha by the ubiquitin-proteasome pathway. J Biol Chem 1999;274:6519–6525.ArticlePubMed
- 8. Stiehl DP, Jelkmann W, Wenger RH, Hellwig-Burgel T. Normoxic induction of the hypoxia-inducible factor 1alpha by insulin and interleukin-1beta involves the phosphatidylinositol 3-kinase pathway. FEBS Lett 2002;512:157–162.ArticlePubMed
- 9. Fukuda R, Hirota K, Fan F, Jung YD, Ellis LM, Semenza GL. Insulin-like growth factor 1 induces hypoxia-inducible factor 1-mediated vascular endothelial growth factor expression, which is dependent on MAP kinase and phosphatidylinositol 3-kinase signaling in colon cancer cells. J Biol Chem 2002;277:38205–38211.ArticlePubMed
- 10. Jiang BH, Liu LZ, Schafer R, Flynn DC, Barnett JB. A novel role for 3, 4-dichloropropionanilide (DCPA) in the inhibition of prostate cancer cell migration, proliferation, and hypoxia-inducible factor 1alpha expression. BMC Cancer 2006;6:204.ArticlePubMedPMC
- 11. Martin KA, Blenis J. Coordinate regulation of translation by the PI 3-kinase and mTOR-pathways. Adv Cancer Res 2002;86:1–39.ArticlePubMed
- 12. Zhang Q, Tang X, Lu QY, Zhang ZF, Brown J, Le AD. Resveratrol inhibits hypoxia-induced accumulation of hypoxia-inducible factor-1alpha and VEGF expression in human tongue squamous cell carcinoma and hepatoma cells. Mol Cancer Ther 2005;4:1465–1474.ArticlePubMed
References
Fig. 1
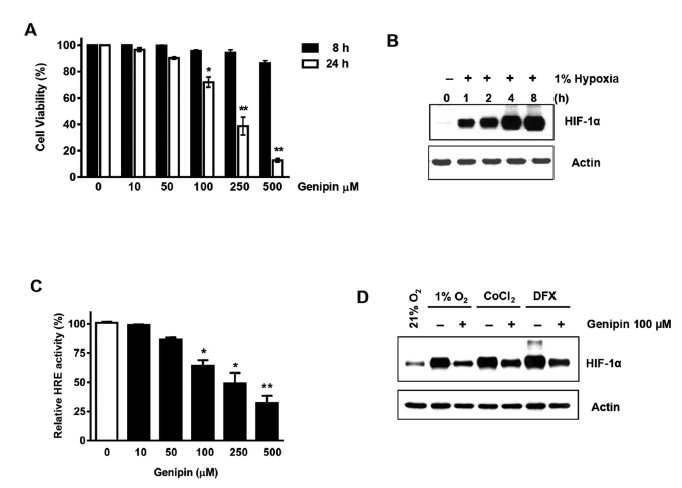
Effect of hypoxia and Genipin on intracellular level of HIF-1α in HeLa cells. (A) Cells were treated with various concentrations (10–500 µM) of Genipin for 24 h. The cytotoxic effect of Genipin on HeLa cells was determined using the trypan blue dye exclusion assay as described in Materials and Methods section. Error bars represent standard error of the mean (S.E.M.) from three separate experiments. (B) Kinetics of HIF-1α accumulation under hypoxic conditions. (C) Kinetics of HIF-1α accumulation during treatment with Genipin for 8 h under hypoxic conditions. (D) Cells were exposed to hypoxia, cobalt chloride, and DFX along with Genipin for 8 h, and then, harvested. Cells lysates containing equal amounts of protein (20 µg) were separated by SDS-PAGE and immunoblotted with anti-HIF-1α antibody. Actin was used as a loading control. Symbols denote a response that was significantly different from the control (*P < 0.05, **P < 0.01).
Fig. 2
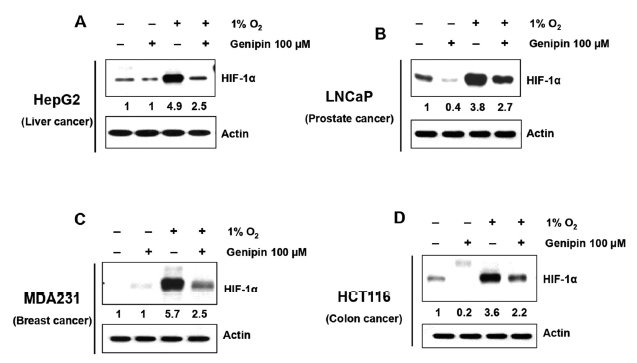
Effect of Genipin on HIF-1α accumulation during hypoxia in various cancer cell lines. HepG2, HCT116, LNCaP, and MDA231 cells were exposed to 1% O2alone or were treated with 100 µM Genipin in combination with 1% O2 for 8 h. Cell lysates containing equal amounts of protein (20 µg) were separated by SDS-PAGE and immunoblotted with anti-HIF-1α antibody. Actin was used as a loading control.
Fig. 3

Role of ERK and Akt in the accumulation of HIF-1α in HeLa cells. Cells were treated with 100 µM Genipin in combination with 1% O2 in the presence or absence of 10 µM LY294002 for 8 h. Cells were pretreated with PD98059 (10 µM) and LY294002 (10 µM) for 30 min followed by treatment with Genipin and/or hypoxia for 8 h in the presence of PD98059 and LY294002. Cell lysates containing equal amounts of protein (20 µg) were separated by SDS-PAGE and immunoblotted using anti-HIF-1α, anti-phospho-Akt (S473), or anti-Akt antibody. Actin was used as a loading control.
Fig. 4

Genipin inhibits production of VEGF and invasion during hypoxia. (A) HeLa cells were exposed to 1% O2 for various time periods (2–24 hours). (B) HeLa cells were treated with various concentrations of Genipin (50, 100, and 250 µM) for 16 h during hypoxia. The concentration of VEGF protein in the culture media was determined by ELISA. The assays were performed in triplicates. The results represent the mean values of VEGF concentrations and error bars represent standard error of the mean from triplicate samples. (C) Invasion indicators are expressed as the mean ± S. D. of three independent experiments. The data was evaluated for statistical significance by Student's t-test. The means noted with an asterisk were statistically different from the matched normoxic control. (D) Western blot analysis shows that Genipin inhibits invasion related proteins in HeLa cells during hypoxic condition. Symbols denote a response that was significantly different from the control (*P < 0.05, **P < 0.01).
Figure & Data
References
Citations
Citations to this article as recorded by 
- Novel Findings regarding the Bioactivity of the Natural Blue Pigment Genipin in Human Diseases
Magdalena Bryś, Karina Urbańska, Beata Olas
International Journal of Molecular Sciences.2022; 23(2): 902. CrossRef - The Effects of Natural and Synthetic Blue Dyes on Human Health: A Review of Current Knowledge and Therapeutic Perspectives
Beata Olas, Jacek Białecki, Karina Urbańska, Magdalena Bryś
Advances in Nutrition.2021; 12(6): 2301. CrossRef - Polyphenols Extracted from Chinese Hickory (Carya cathayensis) Promote Apoptosis and Inhibit Proliferation through the p53-Dependent Intrinsic and HIF-1α-VEGF Pathways in Ovarian Cancer Cells
Zhiping He, Shaozhen Wu, Ju Lin, Ashley Booth, Gary O’Neal Rankin, Ivan Martinez, Yi Charlie Chen
Applied Sciences.2020; 10(23): 8615. CrossRef
 PubReader
 ePub Link
 Cite
Cite


